Information Architect, Researcher
Director of Marketing, Project Manager, Lead Copywriter, UX Designer
In late 2018, an initiative led by the engineering department was underway to unify the dozens of software and services in use throughout Glidewell Dental under a more cohesive platform. To give an example, users needed to remember separate logins to access billing, shopping, and educational content even though all three were through Glidewell. Internally it was becoming increasingly difficult to gather any metrics from all the services and get a clear view of a customer’s activities across Glidewell.
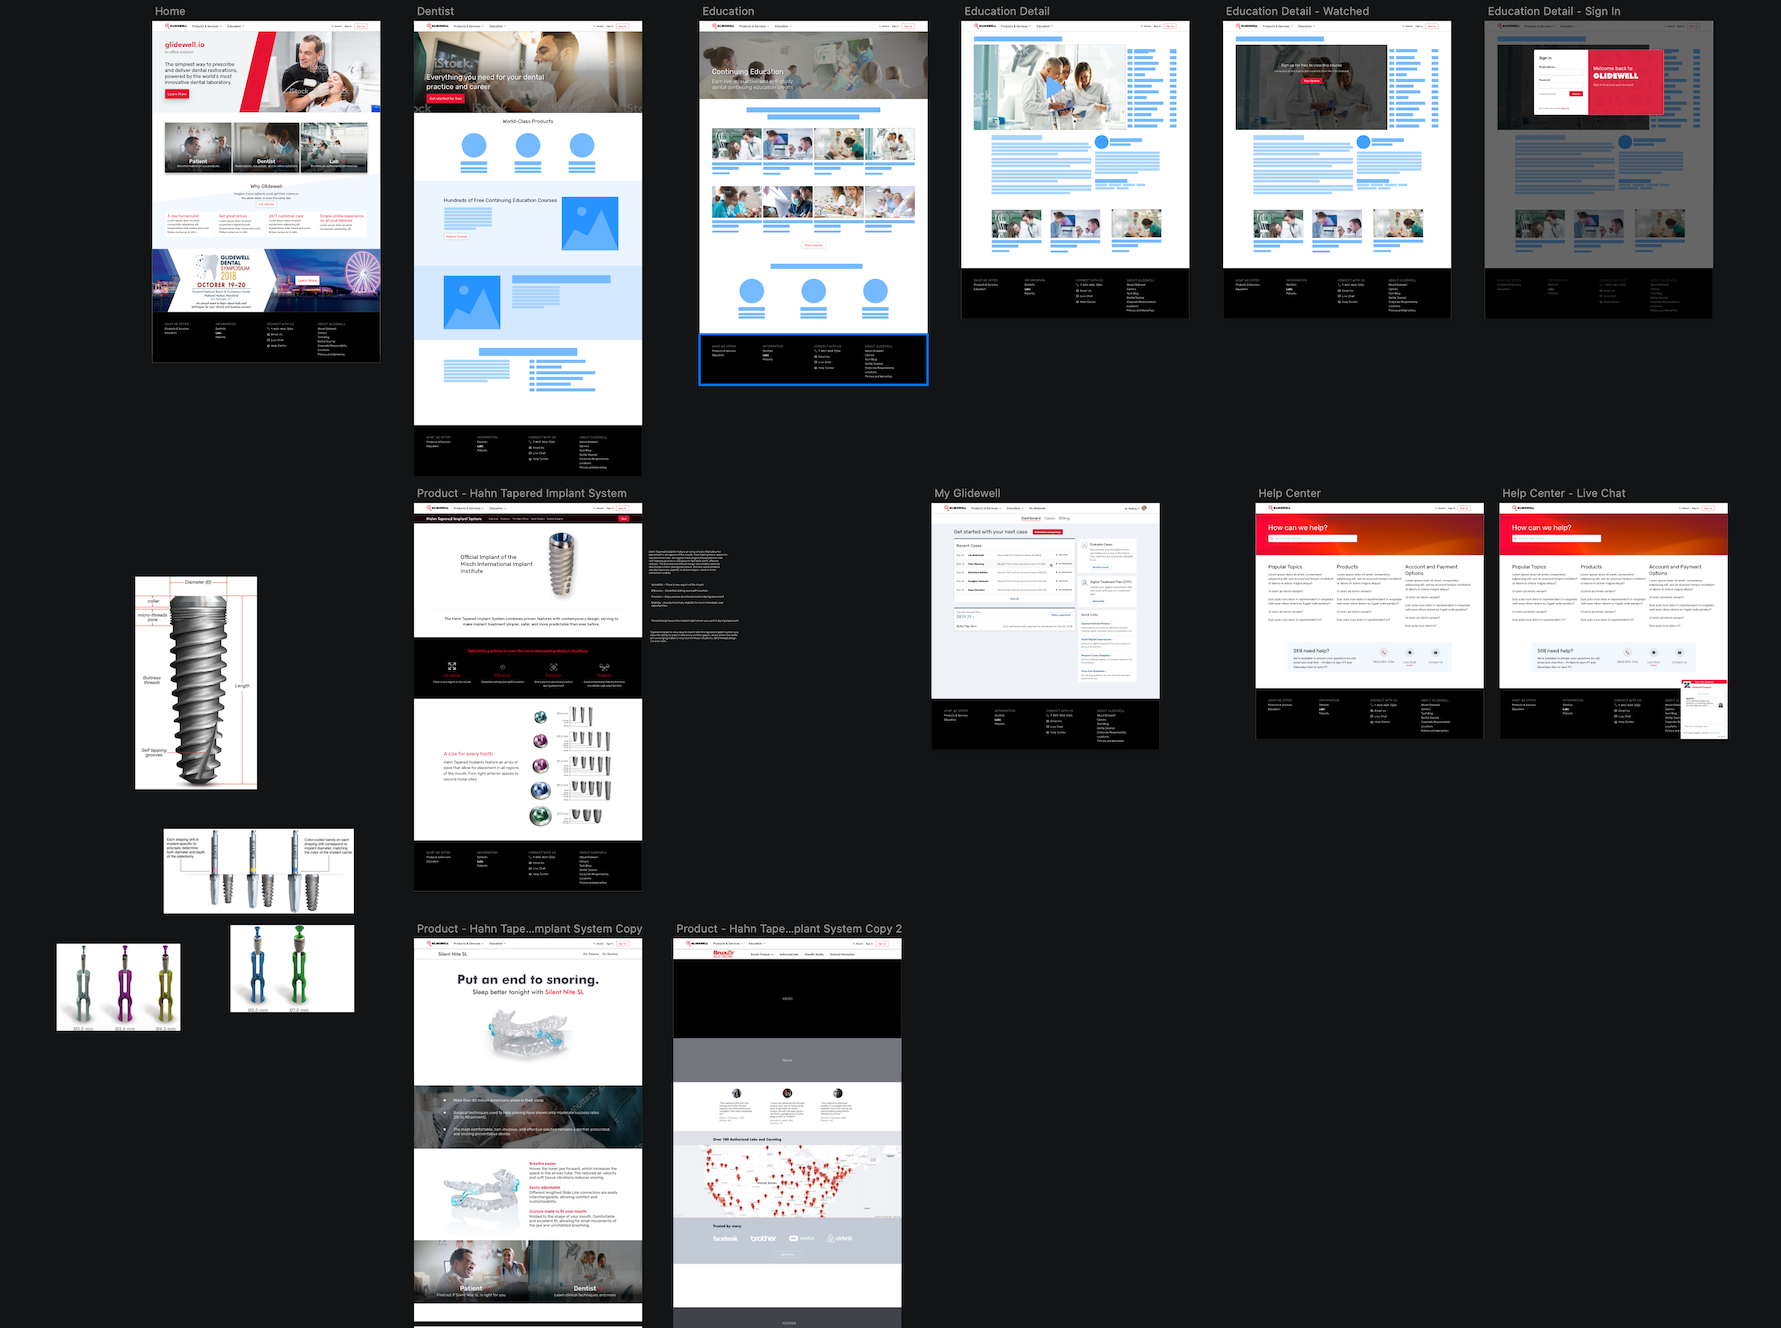
To better illustrate what creating a unified experience would mean to our customers, our team of four UX designers was approached with building out a “pitch deck” to provide visuals. The deck proved successful and lead into a company rebranding project in early 2019.
The main target of the company rebranding would be the corporate website. I was put in charge of updating the information architecture to organize all of the content that had amassed on the website, and use quantitative and qualitative research to better understand our audience and what content should be highlighted.
My first goal was in getting a better understanding of who was visiting our website, and what information they were hoping to find. While the “who” was broadly determined to be anyone in the dental industry or seeking dental information, we needed to get more nuanced to better tailor the content.
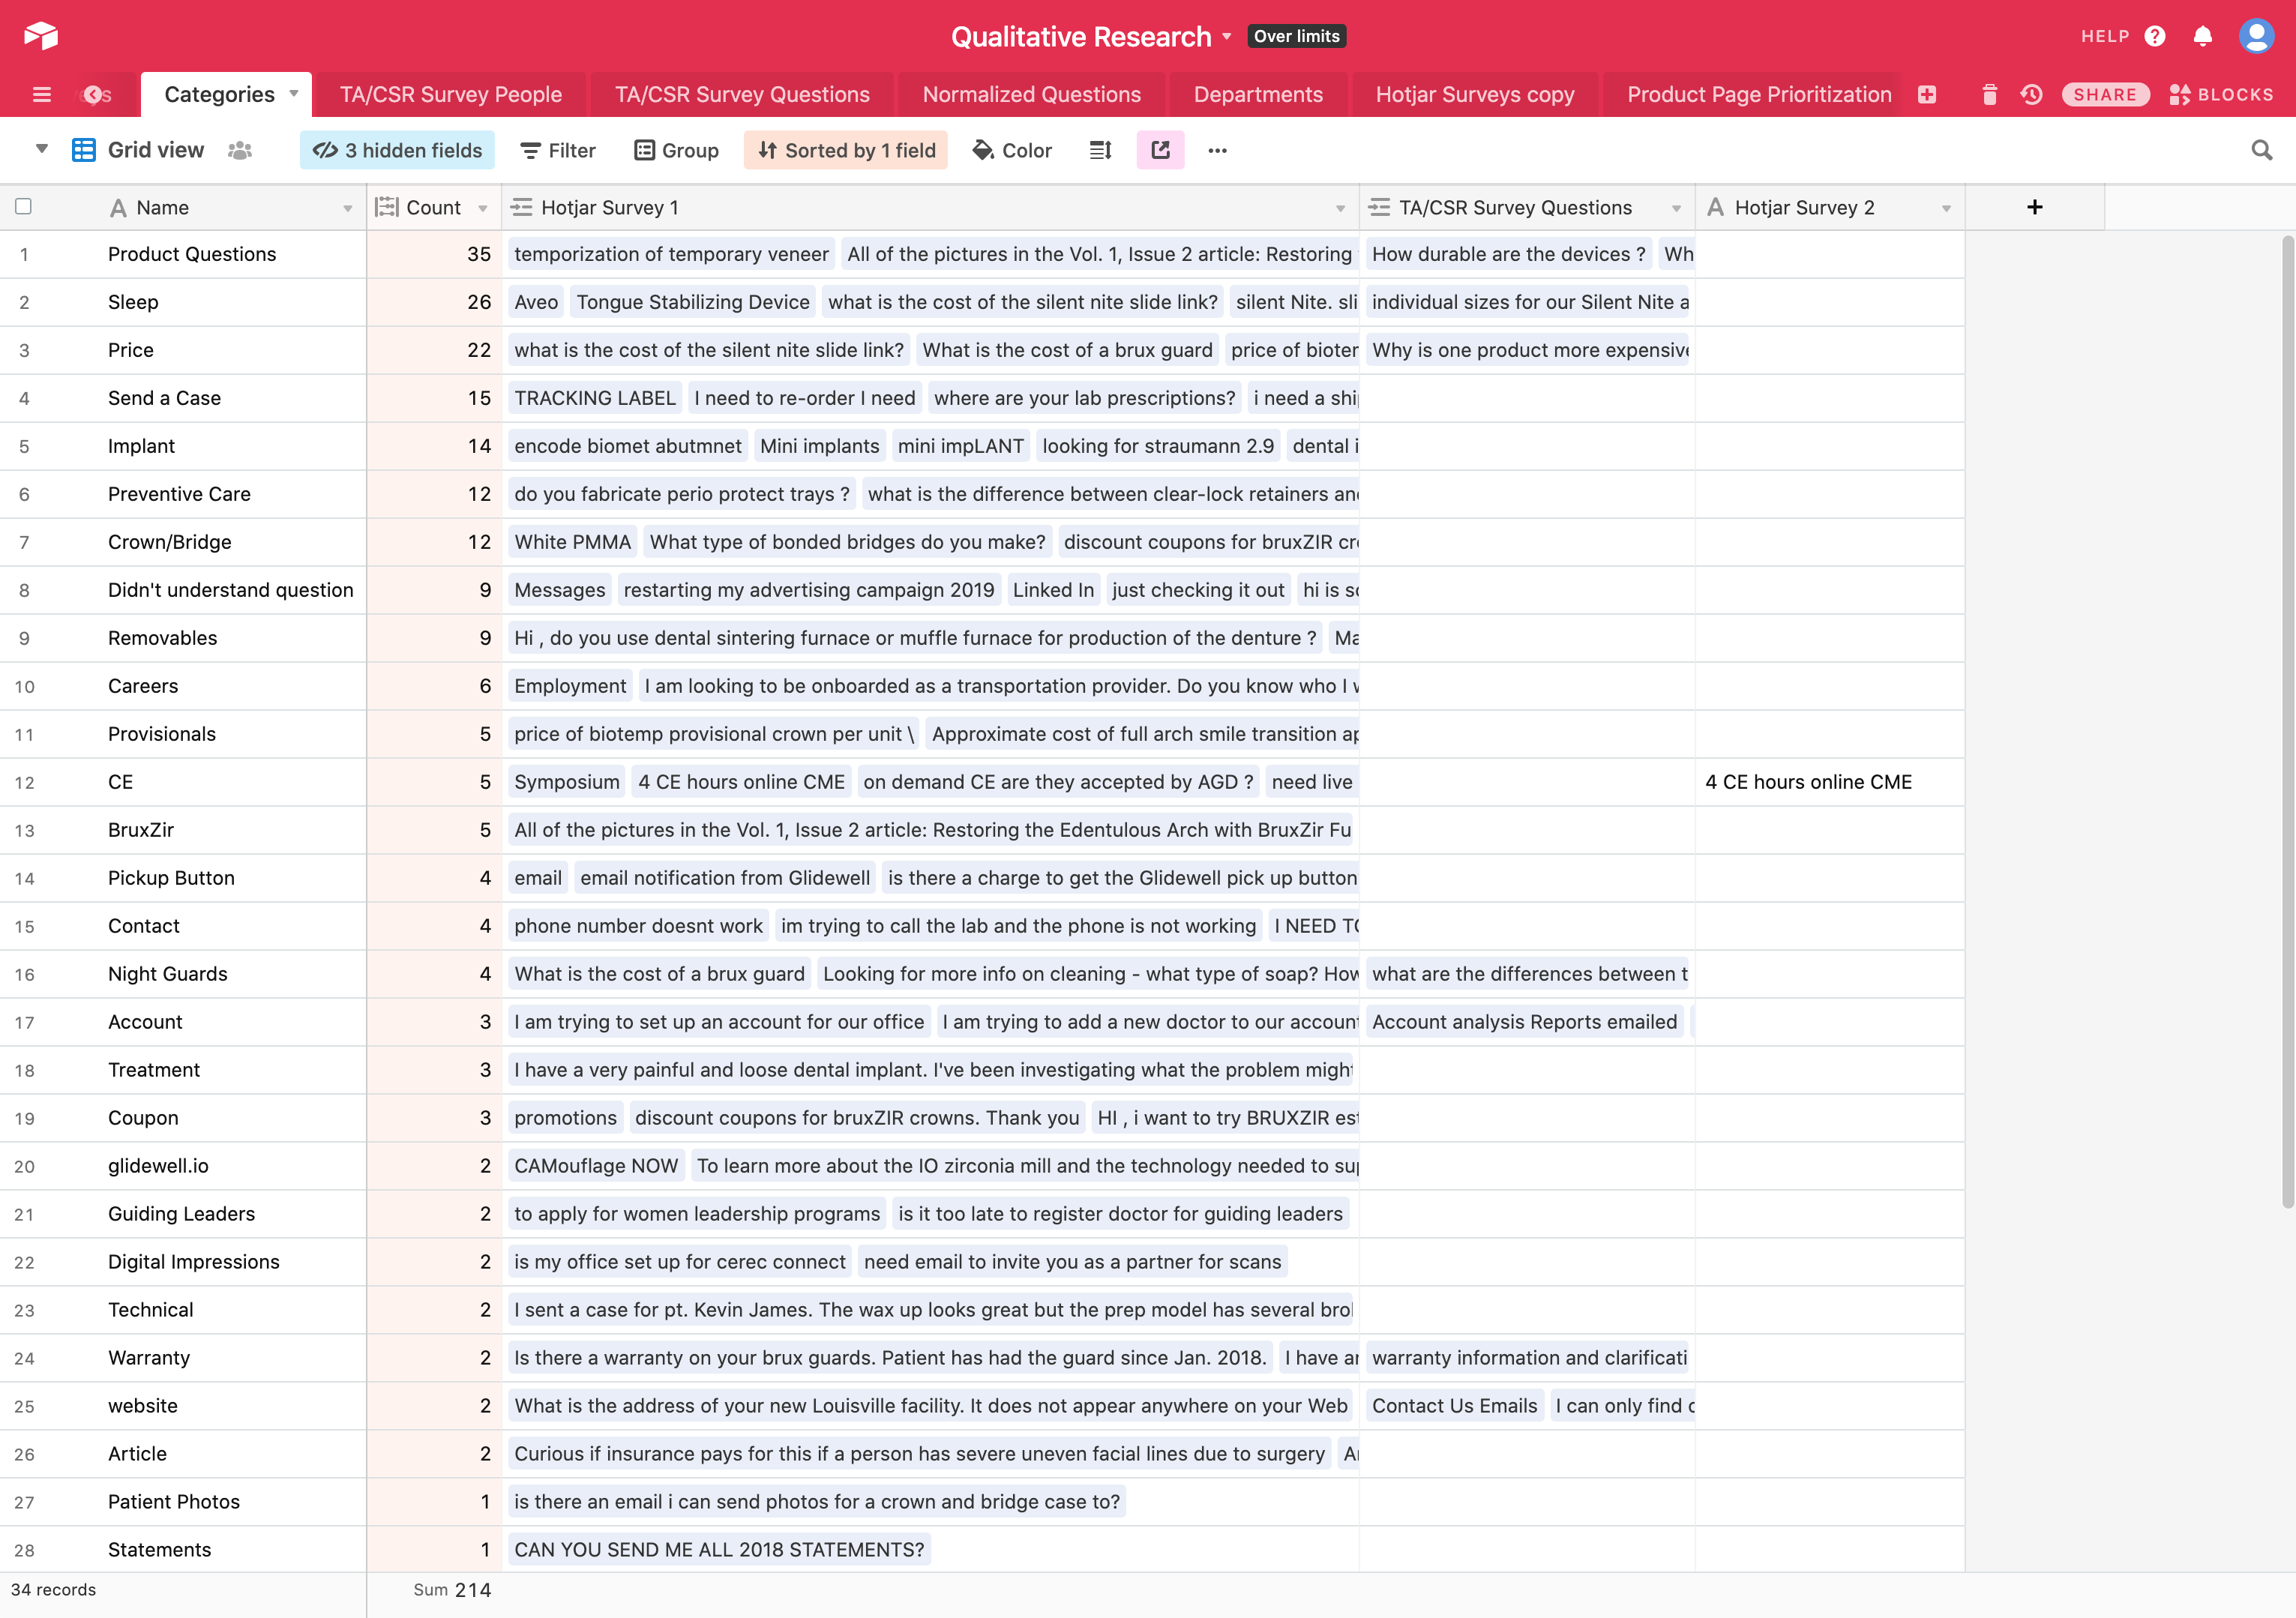
A survey was launched on the existing corporate website that asked visitors, “What brought you here today?” Their answers would provide the information they were seeking out, and by doing some analysis (and educated guessing) on the language and content in the answers, we could figure out whether they were in the dental industry or not.
After gathering enough answers from a decent sample size, we came to find that 11% of our visitors were patients, 62% were in the dental industry, and the rest were not conclusive enough for us to put into either bucket. The answers were also coded into themes, giving us a breakdown of what visitors were seeking out (e.g., pricing on products, questions about product usage and care, sleep dentistry products, etc.)
To supplement this new data, we also looked at site metrics to see which areas of the site were being visited the most, usability tests and user interviews from the past that may have provided insight into user behavior and motivations, and finally, our customer support teams that interact with our customers on a daily basis over the phone.
After coding and synthesizing the research, we came out with three main goals of our site visitors:
With these in hand, we then made decisions on what visitors would do with the answers, and pulled in quotes as examples:
Goal:
I need a product for a patient but have some questions about the product itself.What will they do with this information: Make an informed decision on which product to use for the patient I am treating.
Examples:
- “What is the difference between tap3 and dreamtap?”
- “Name of the flexibility denture material and it’s chemistry and how it’s different from valplast.”
- “What’s the lab cost for full arch implant bridge (all on 4 type) on Nobel/Straumann implants.”
It’s important to note here that the topic of patients visiting our website continually came up, and there was a sort of gray area that the company did not interact directly with dental patients, and none of the existing content was catered towards them. A decision was made to focus on the dental industry first, and come back at a later time to address the needs of patients.
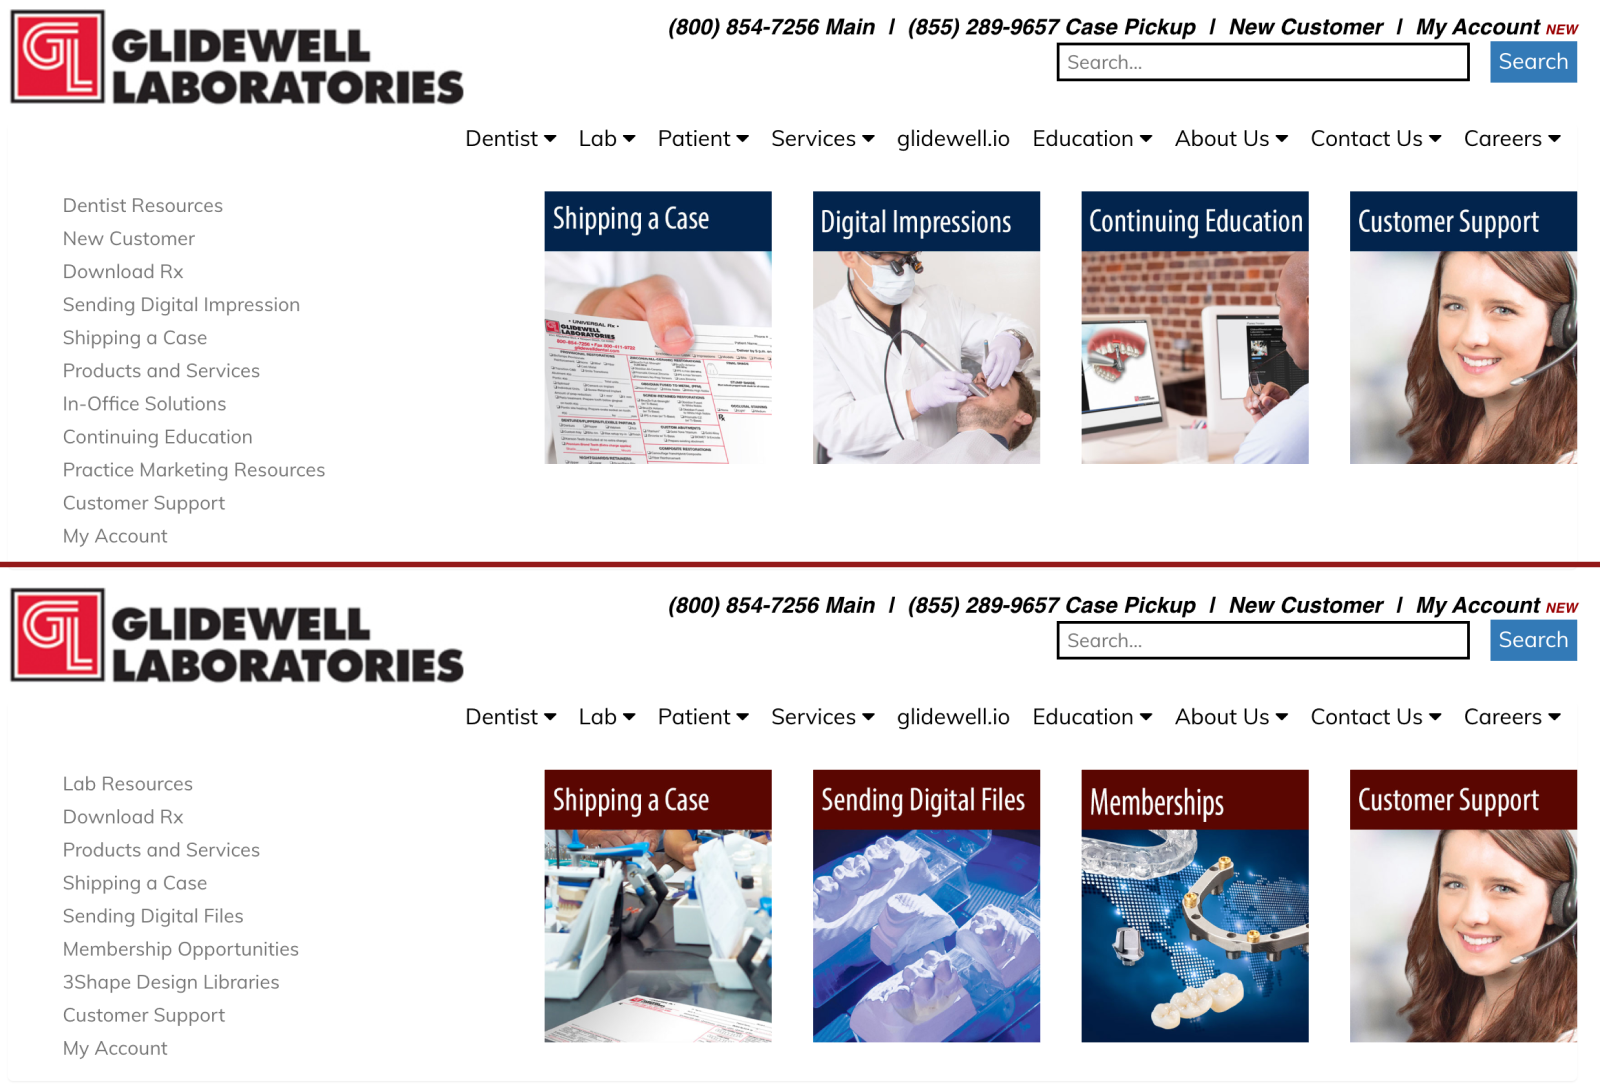
Now we could move on to creating and structuring the IA (information architecture). Because this was a redesign of an existing website and not something being built from scratch, that meant we had an existing IA that could be used as a benchmark and improved upon. To measure the effectiveness of the existing and proposed IA we decided on tree testing.
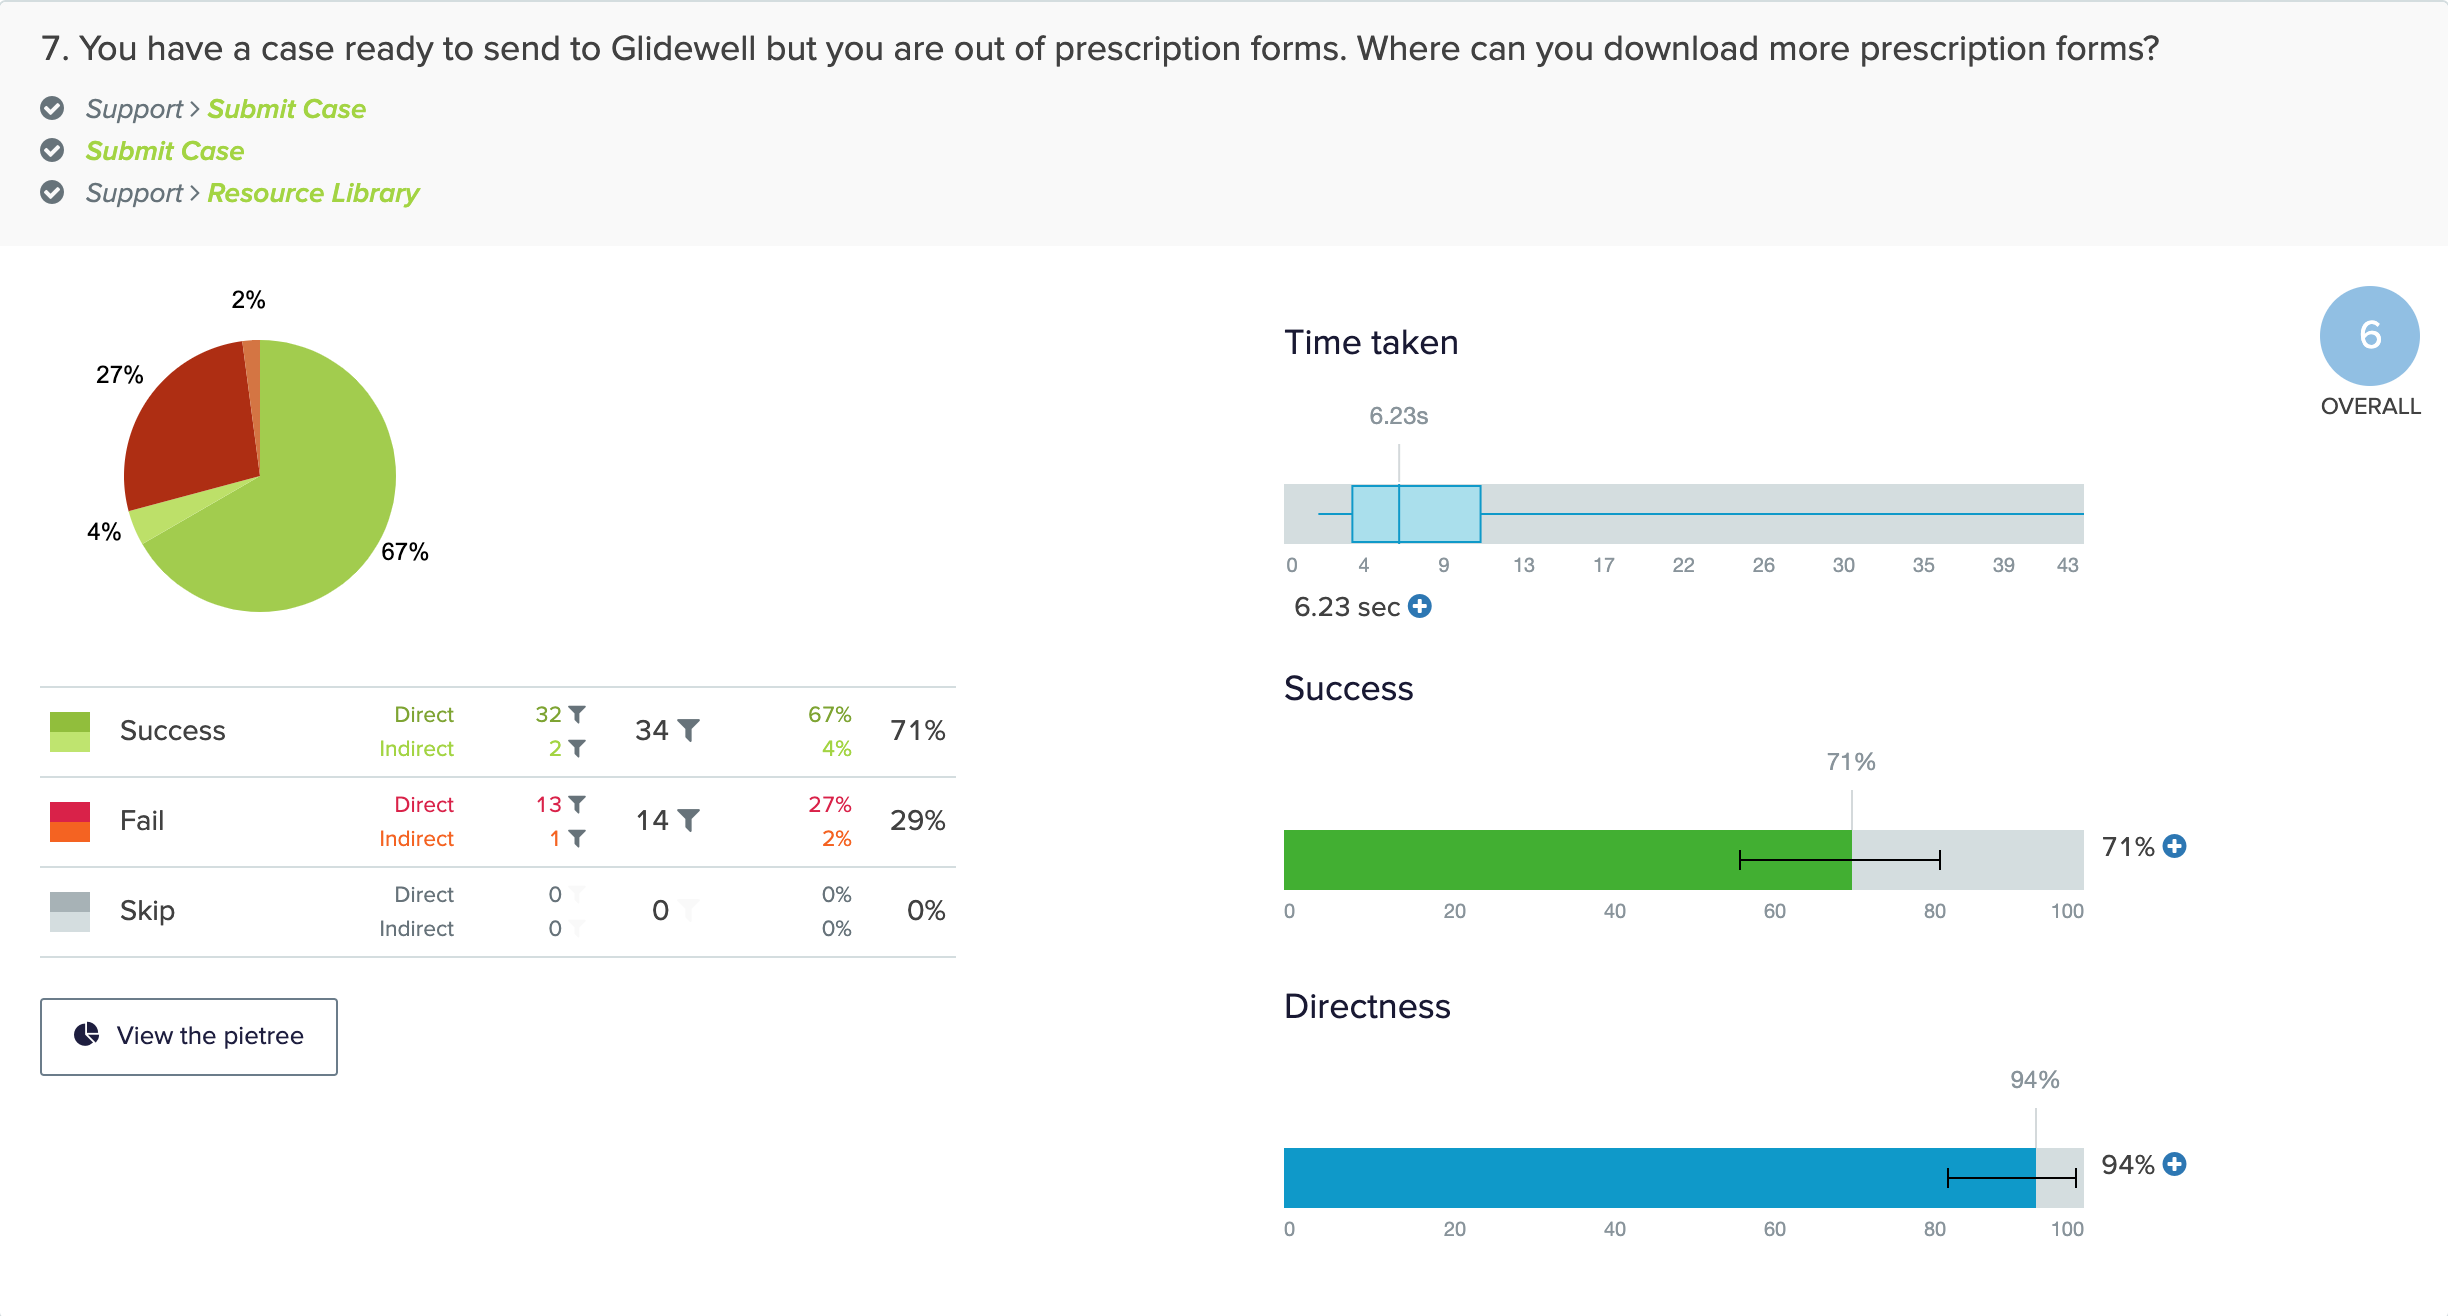
Tree testing is a way to measure the effectiveness of the labels in a website hierarchy, and how easy it is to find topics within the tree. All it requires is the website structure (tree), tasks for participants to find information in the tree, and participants.
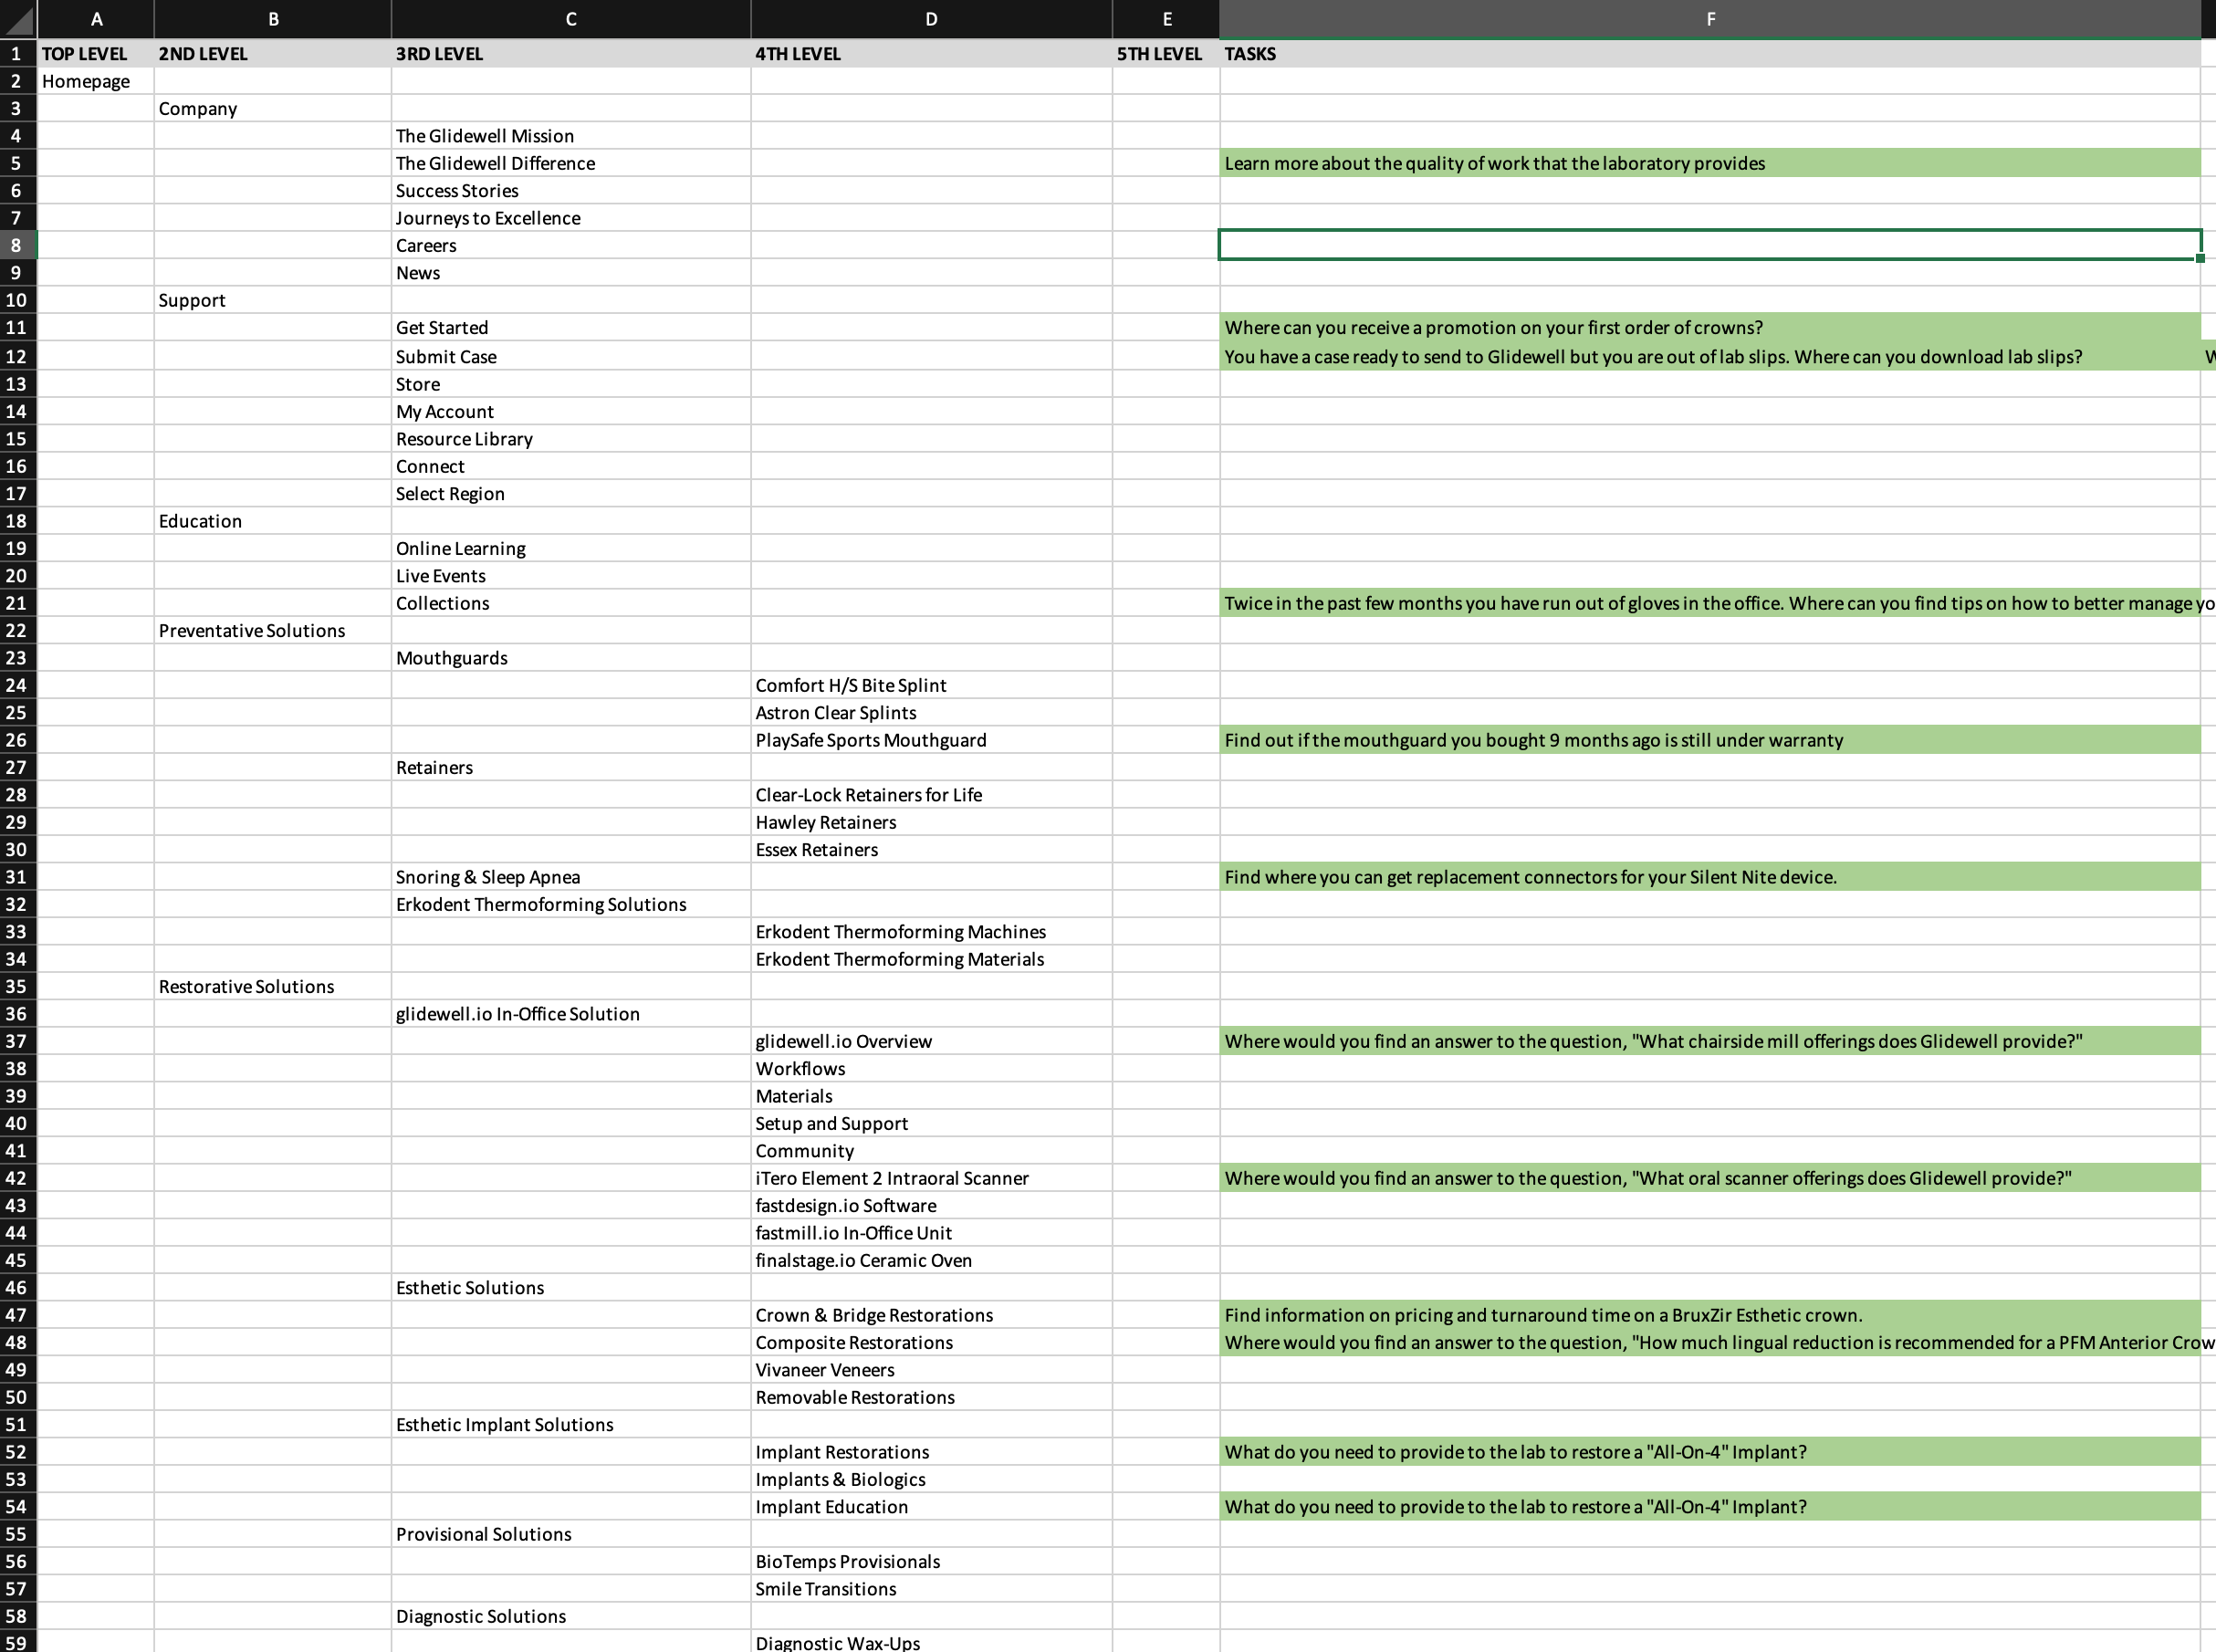
Since we knew what goals visitors were seeking to accomplish from earlier research, creating the tasks were fairly simple. To make sure we were getting enough coverage in the tree, and to ensure that important topics were being covered, 13 tasks were created from the goals, some of which even came directly from our visitors.
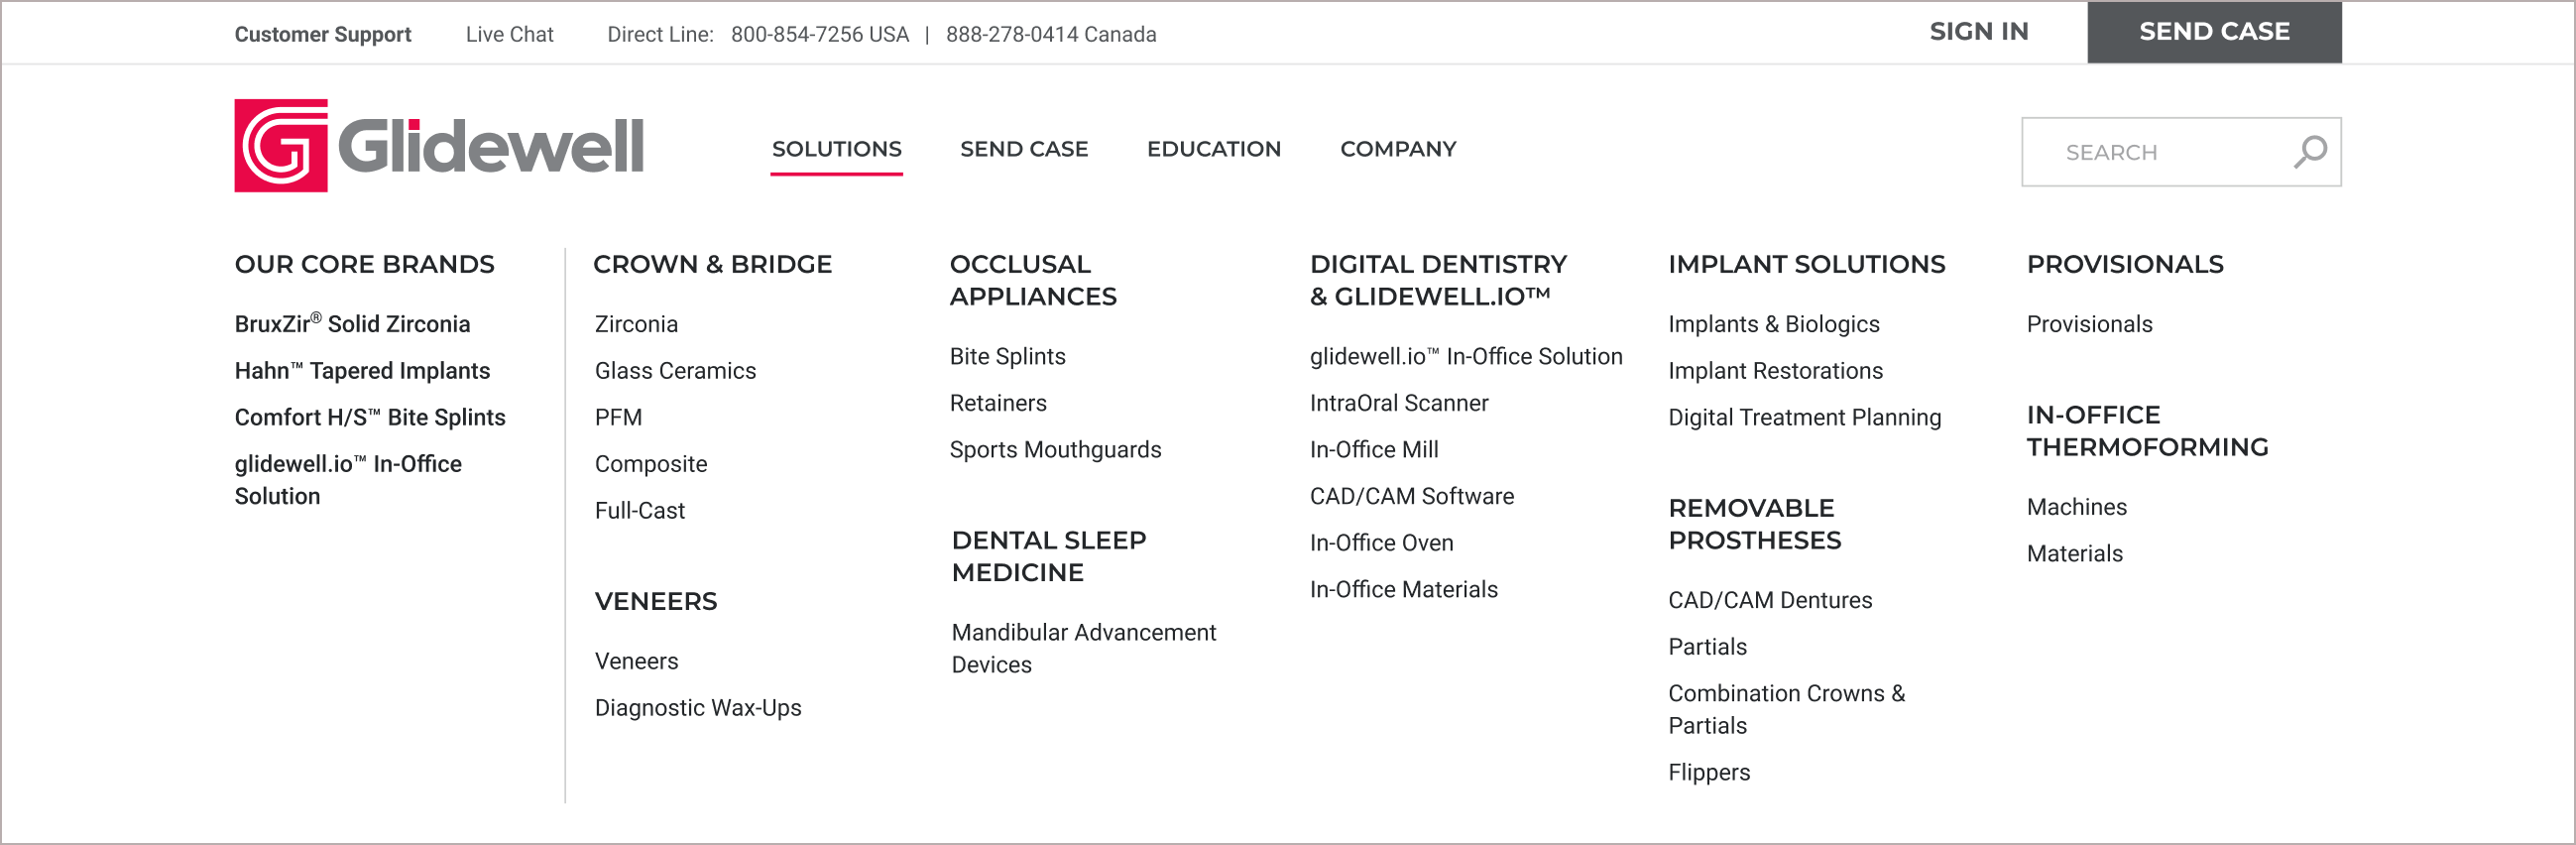
When it came time to create the new IA, I leaned on the existing tree to see what worked and didn’t work and iterated from there:
The tree I created leaned heavily on the user research gathered, focusing on the products and offerings, educational topics, and conducting business with the company. It resulted in a much leaner and simplified tree that was ideally more understandable. This tree was tested along with a second tree that was more brand-focused.
The three trees and tasks were input into a third-party program along with the tasks with the corresponding branches marked as correct answers. To recruit participants, a popup was placed on the existing corporate website inviting visitors to take the test and be rewarded with an incentive. Once participants were in the test, a simple demographic answer helped to target our audience. Participants were randomly shown one of the three tests to help ensure equal sample sizes for each tree.
After the results rolled in, the existing navigation showed a 28% success rate - considered to be a fail and a need to be completely rethought. For the new trees, the brand-focused tree scored 41% (also considered a fail) and the topic/activity tree scored 65% (a success). Seeing the original tree score a 28% helped validate the entire idea of redoing the information architecture, and the score of 65% really validated all of the decisions up to this point.
Earlier I mentioned that we wanted to get our broad dental industry audience broken down to be more specific. The tree test allowed us to get that by asking for this information - it showed that half of our audience was dentists, followed by patients, then dental assistants, office managers, and laboratory technicians. Since all of these cohorts were already being accounted for in the website redesign, we felt confident that we were on the right track. This information could also be used for future projects and even persona creation.
One more tree test was run after combining the best parts of the two new trees in an effort to get a higher score. This final test also came back at 65%, which was not an improvement from the first test. While 65% is at the bottom-end of an acceptable result, we decided to move forward with the tree given the unlikelihood of participants being familiar with everything being asked, and also seeing that no improvement is better than receiving a lower score.
A month after the new site launched, the same poll that was run before the redesign was run again to gauge the success. The results revealed that roughly the same amount of users were able to find what they wanted on the site as before the redesign - there was no change in the score.
One could argue that this is a good thing, but it wasn’t the expected result after seeing the tree test result of the original IA. Most of the reason for the score was attributed to the fact that the primary link to sign in to the customer portal previously said “My Account,” and it had now been changed to “Sign In”. Customer support reported that a lot of customers were calling in unaware of how to get into My Account.
We decided to keep on with “Sign In” because the goal was that signing into your account would provide you to more access beyond just the customer portal, and this was to lead into features planned for the future. The hope was that in time the site visitors would acclimate to the change and another poll would be run again to see if there was change. Unfortunately with the onset of COVID-19 we haven’t found the time to revisit the outcomes, and the change in behavior has made it difficult for an apples to apples comparison.