My Account Dashboard

Glidewell Dental

Role

Research, Product Design, Metrics.

Team

VP of Operations, Product Owner, Technical Lead, 3 Developers

Background

Glidewell Dental’s primary business is in creating and delivering dental crowns (caps for teeth that are designed to restore their original size and shape) to be permanently placed in a patient’s mouth by their dentist. Because Glidewell Dental is not the one directly applying the crowns to the patient, it can be difficult to understand if our products meet expectations.

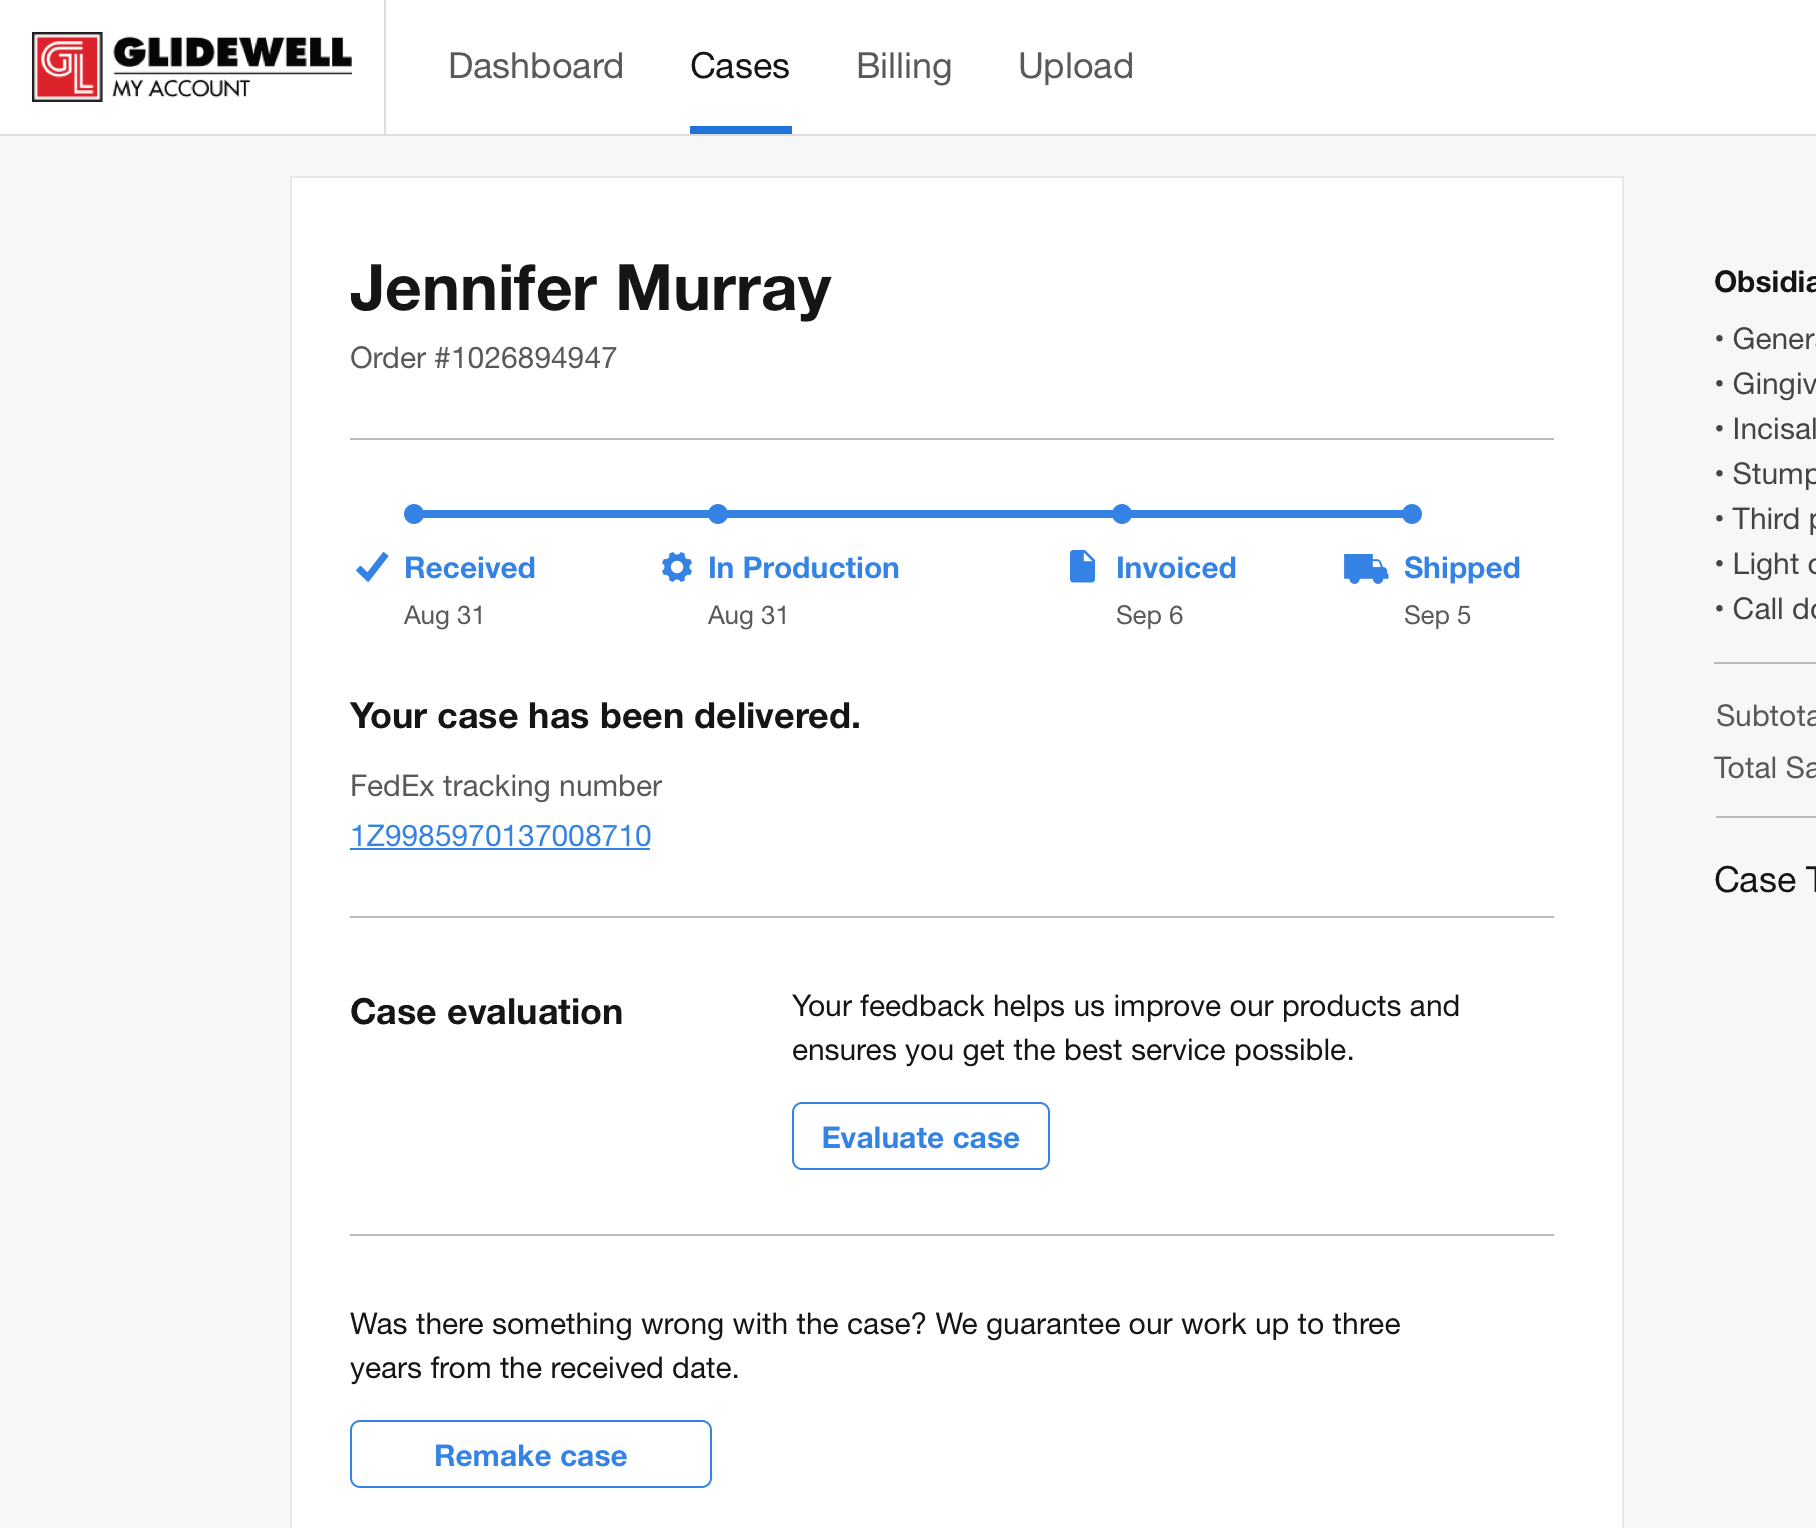
The process of a dentist requesting and receiving a crown from Glidewell is referred to as a case. To gather the required feedback from our cases, an evaluation slip is included in every case that goes to the dentist.

On average Glidewell will receive 3,500 evaluations in the mail every week.

We use the feedback provided on the evaluations to go back and improve our processes wherever there may be shortcomings, all in an effort to be the best partner to our customers. This cycle of consistently gathering feedback keeps us empathetic to the dentists’ needs as they build a business of their own.

Identifying the problem and goal

In an effort to reduce the handling and processing costs of paper evaluation slips, and also to make it easier for dentists to submit evaluations, a feature in the customer portal (My Account) was created to allow customers to submit their evaluations online. However, despite being available for months the feature was not receiving as much usage as expected.

Case detail screen
The option to evaluate a case appears once a case has been shipped.
Case evaluation screen
Modal window allowing user to evaluate a case.

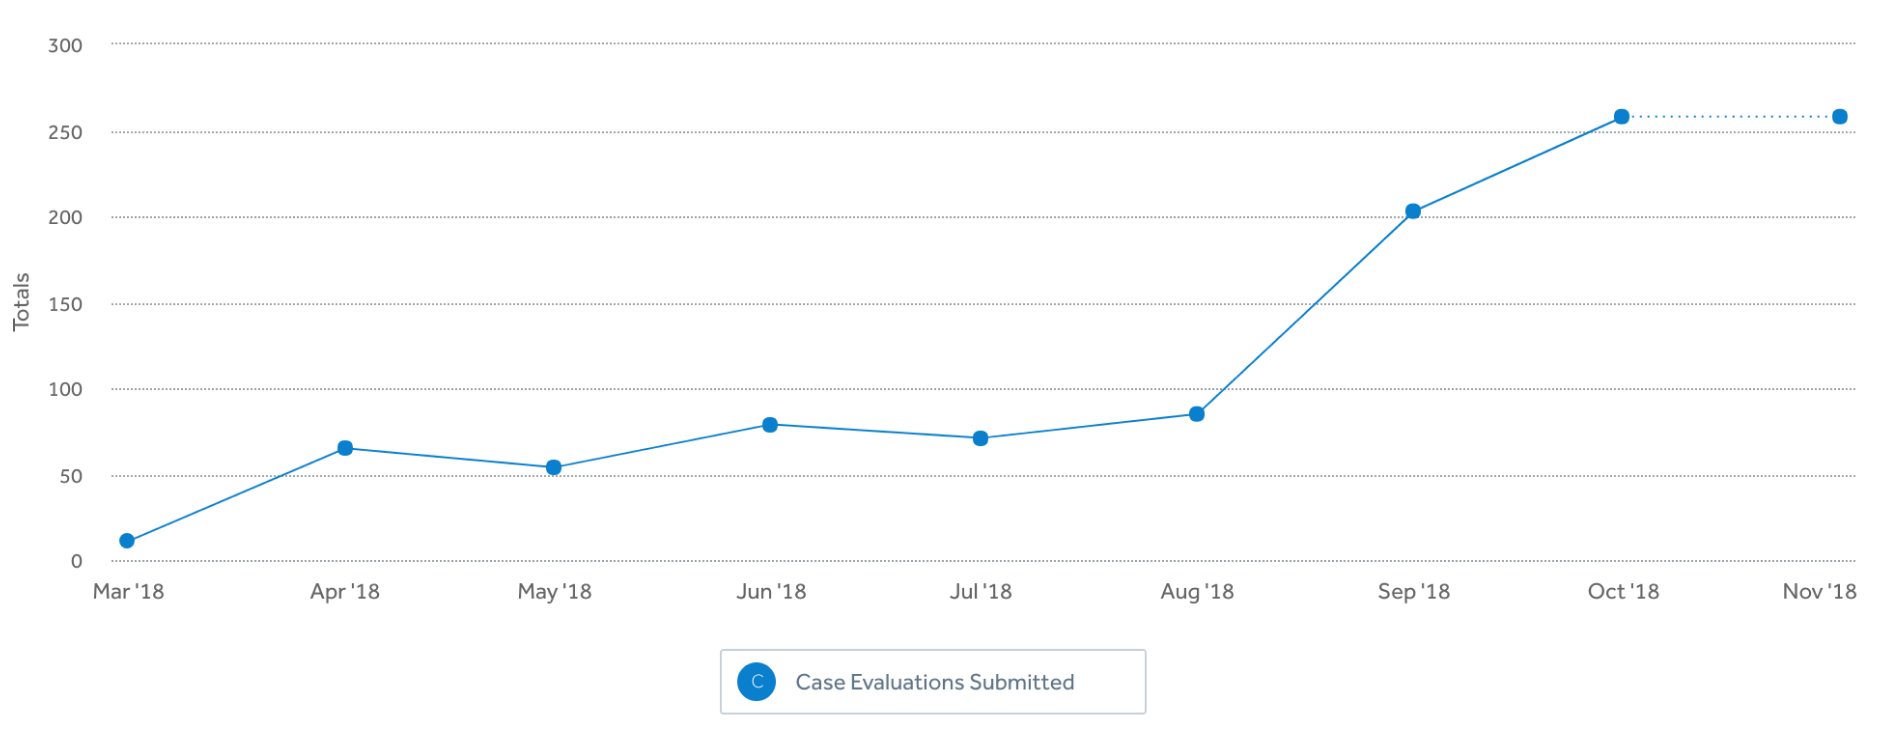
Since the launch of the feature, case evaluations were received through My Account at an average of around 17 evaluations per week. This was a stark contrast to the average of 3,500 evaluations being received in the mail every week.

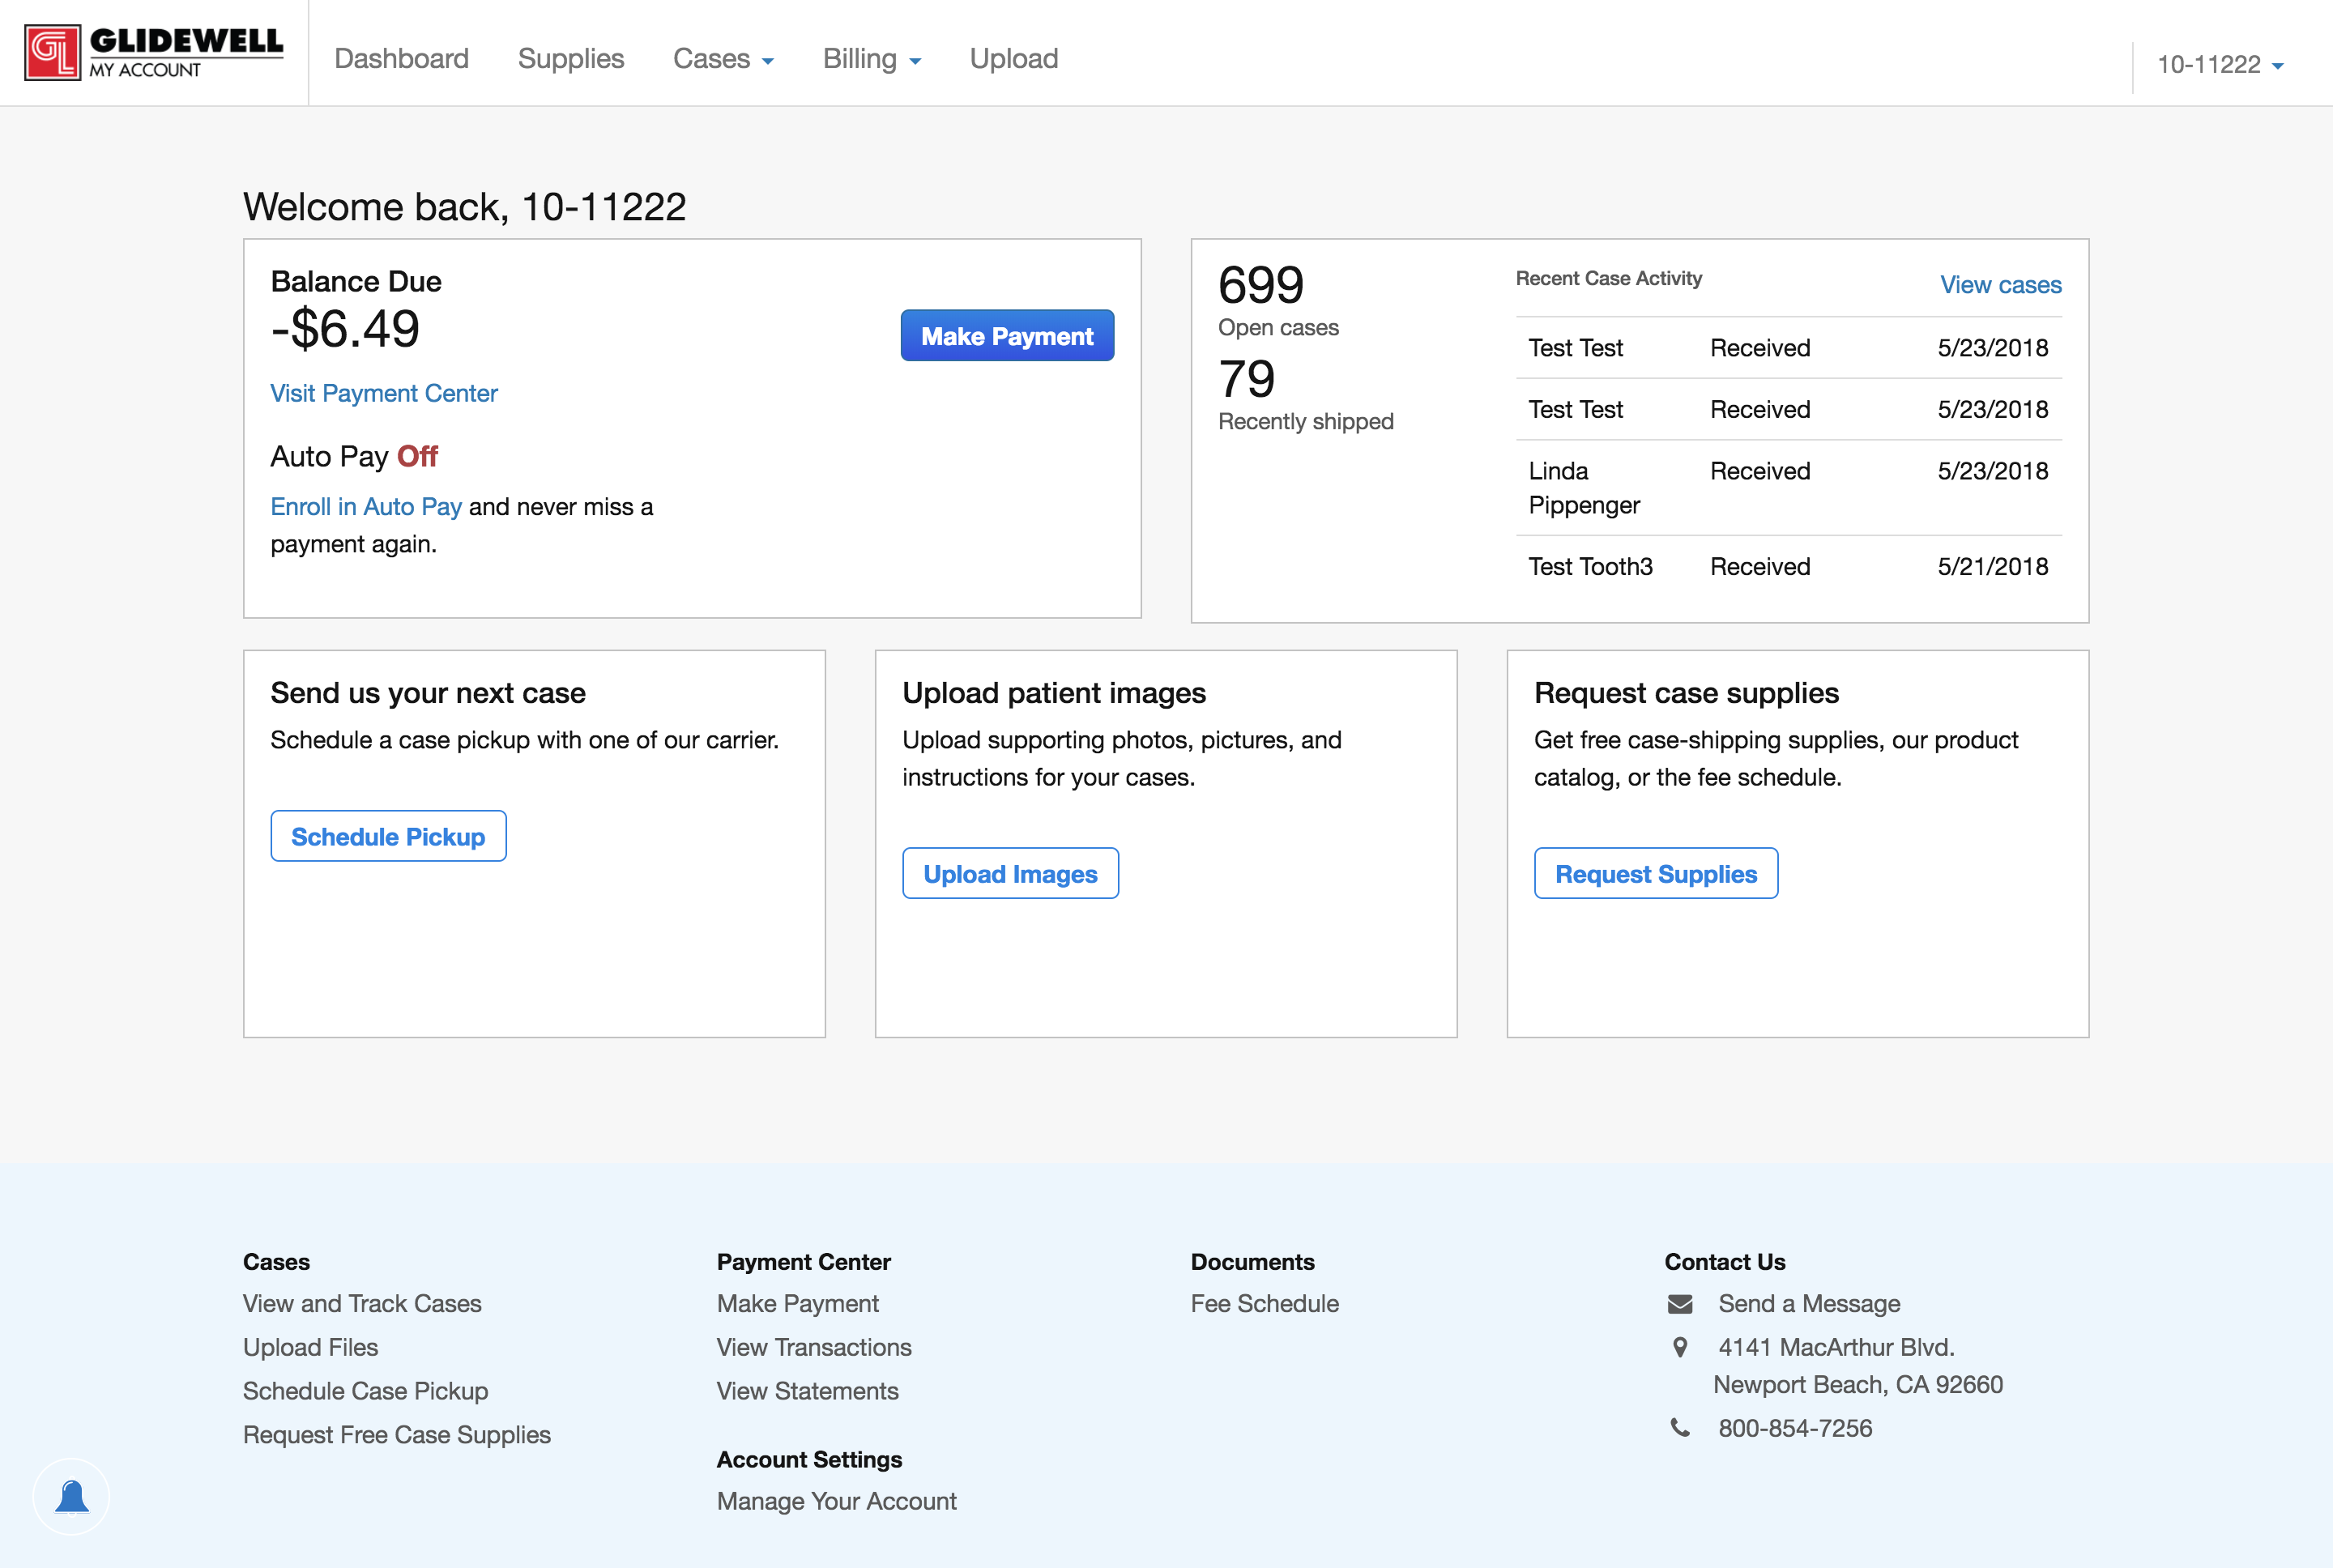
To be fair, not all of Glidewell’s customers use the customer portal. Most of the activity in the portal is around requesting a carrier to pick up a case, checking on case statuses (tracking numbers), and paying the monthly bill. The expectation was not that the website would receive all 3,500 evaluations immediately when the feature released.

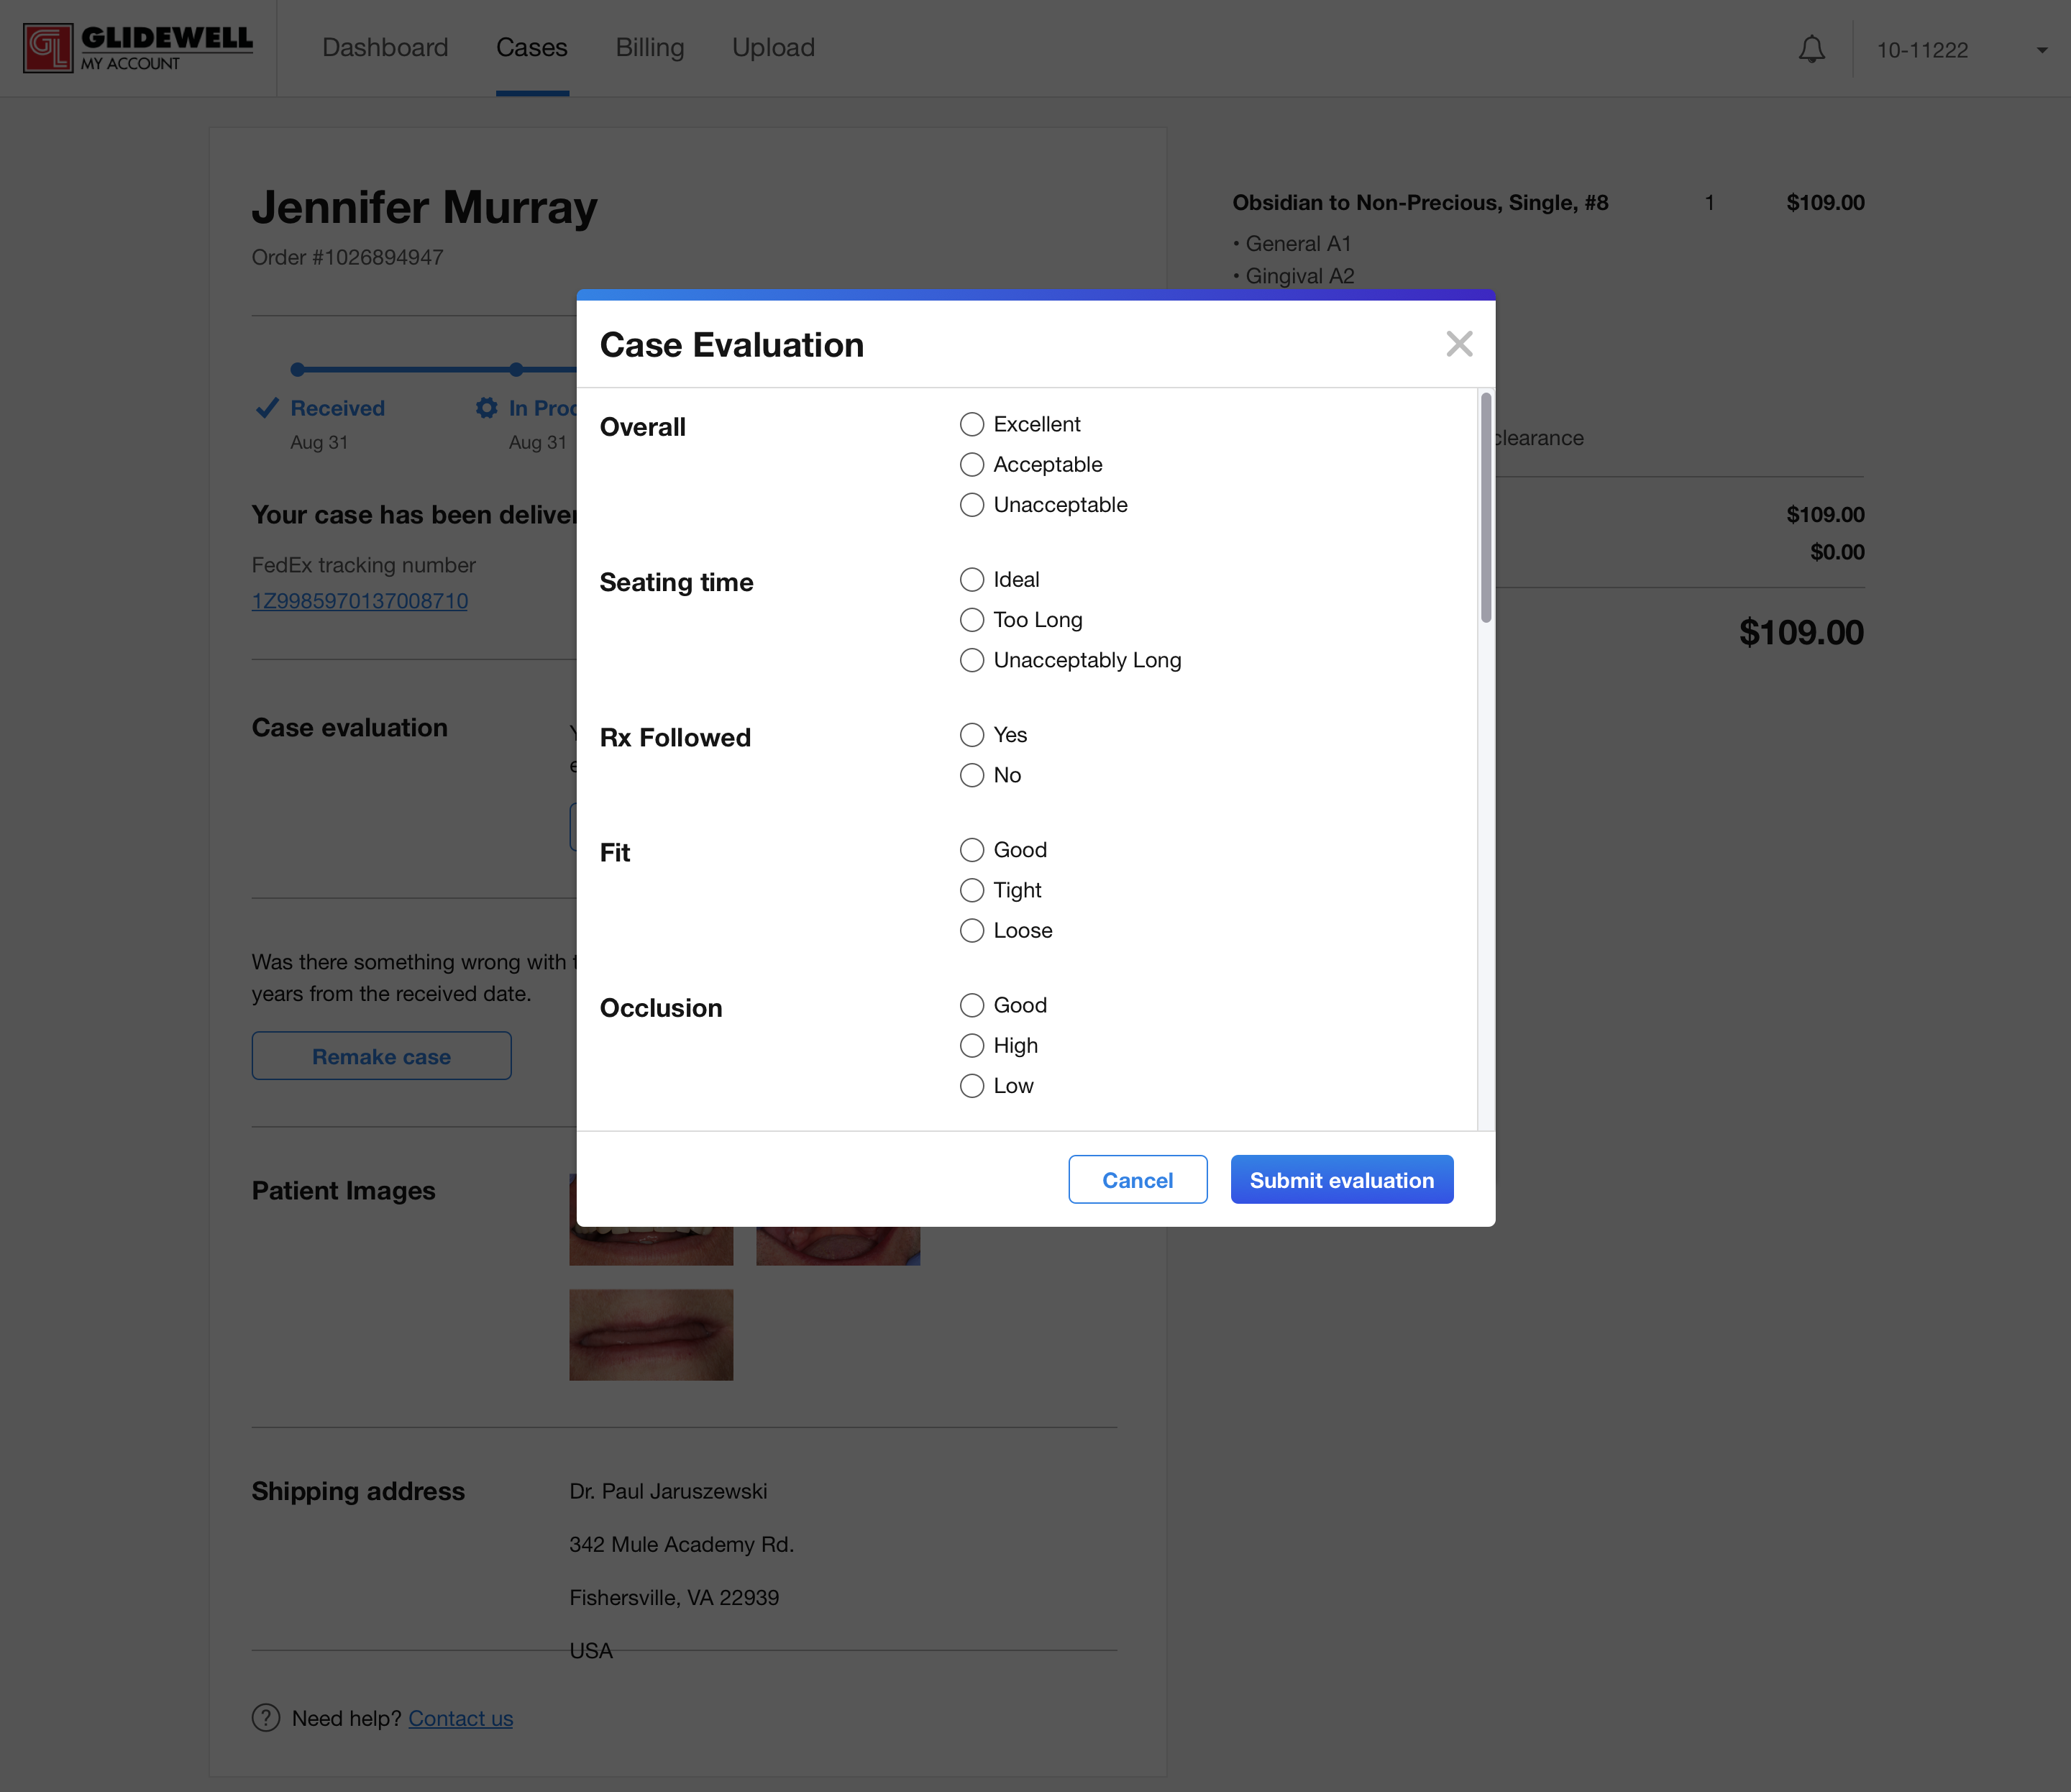
It would be great to encourage doctors to fill out the case rating form so that we can get feedback on the quality of the case.

After looking at usage numbers of the portal, we came to a target number of 93 evaluations a week. The target was enough for us to define success and recognize that there was room for improvement.

Where do we start?

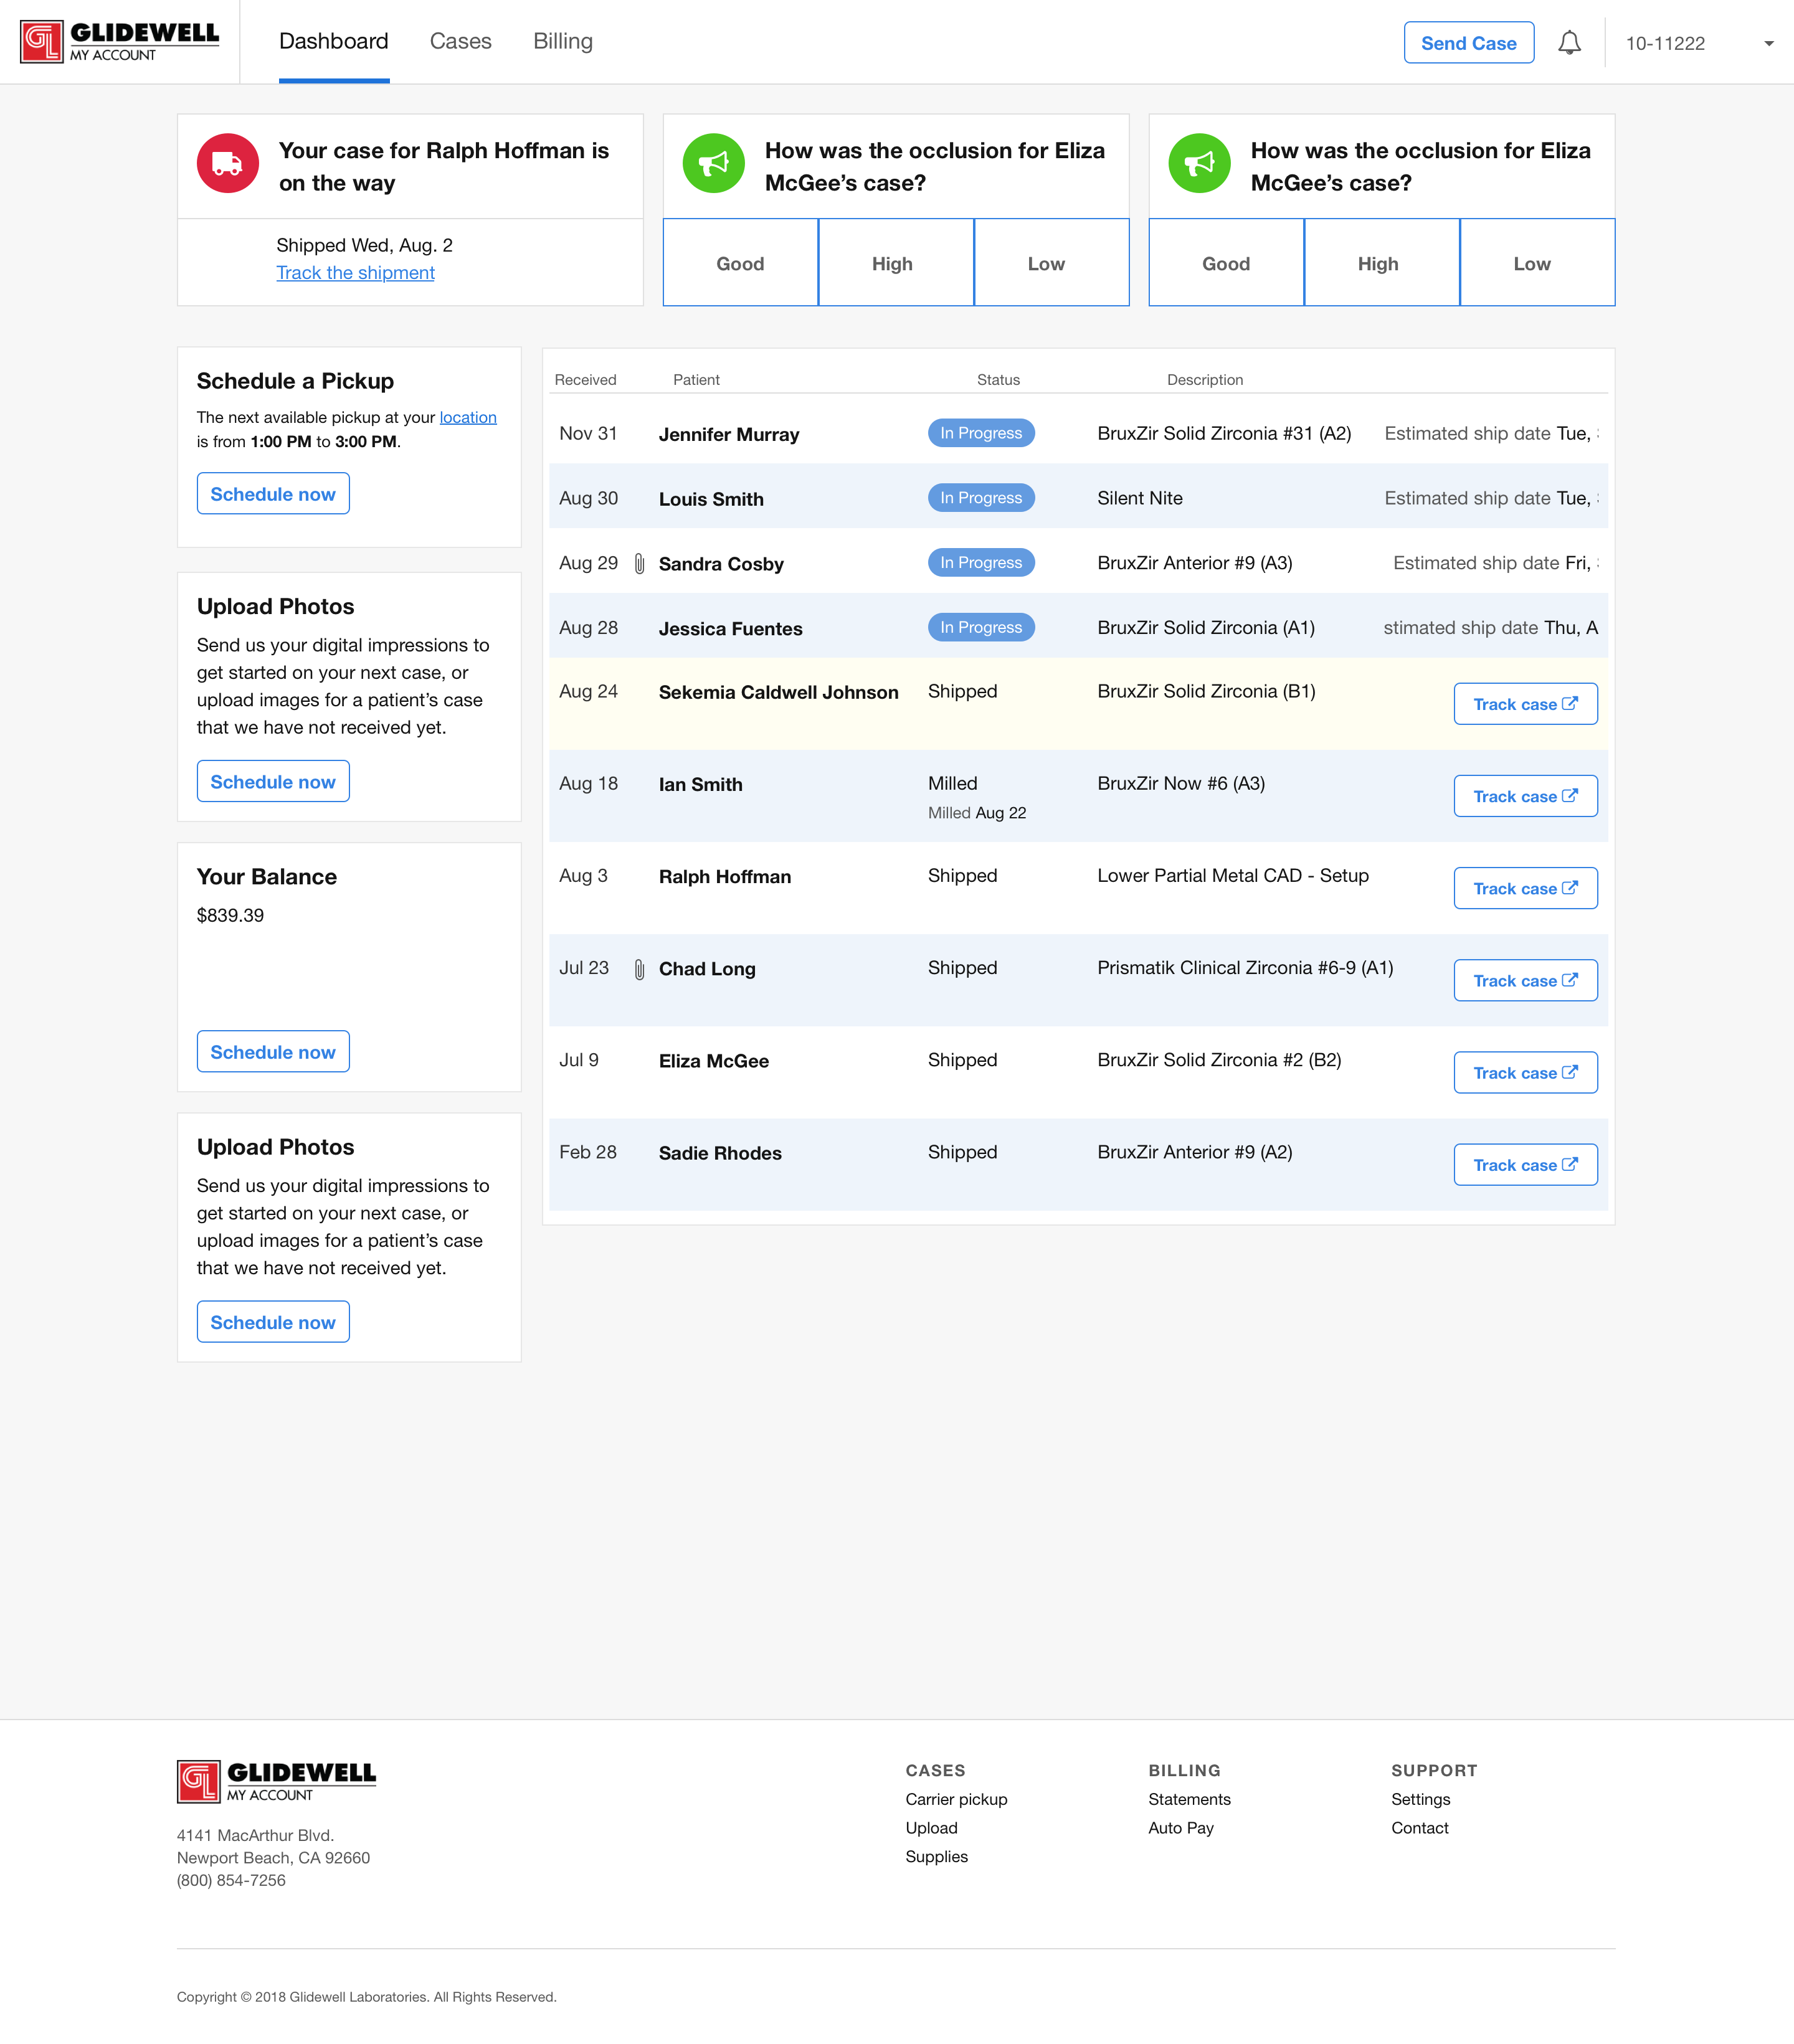
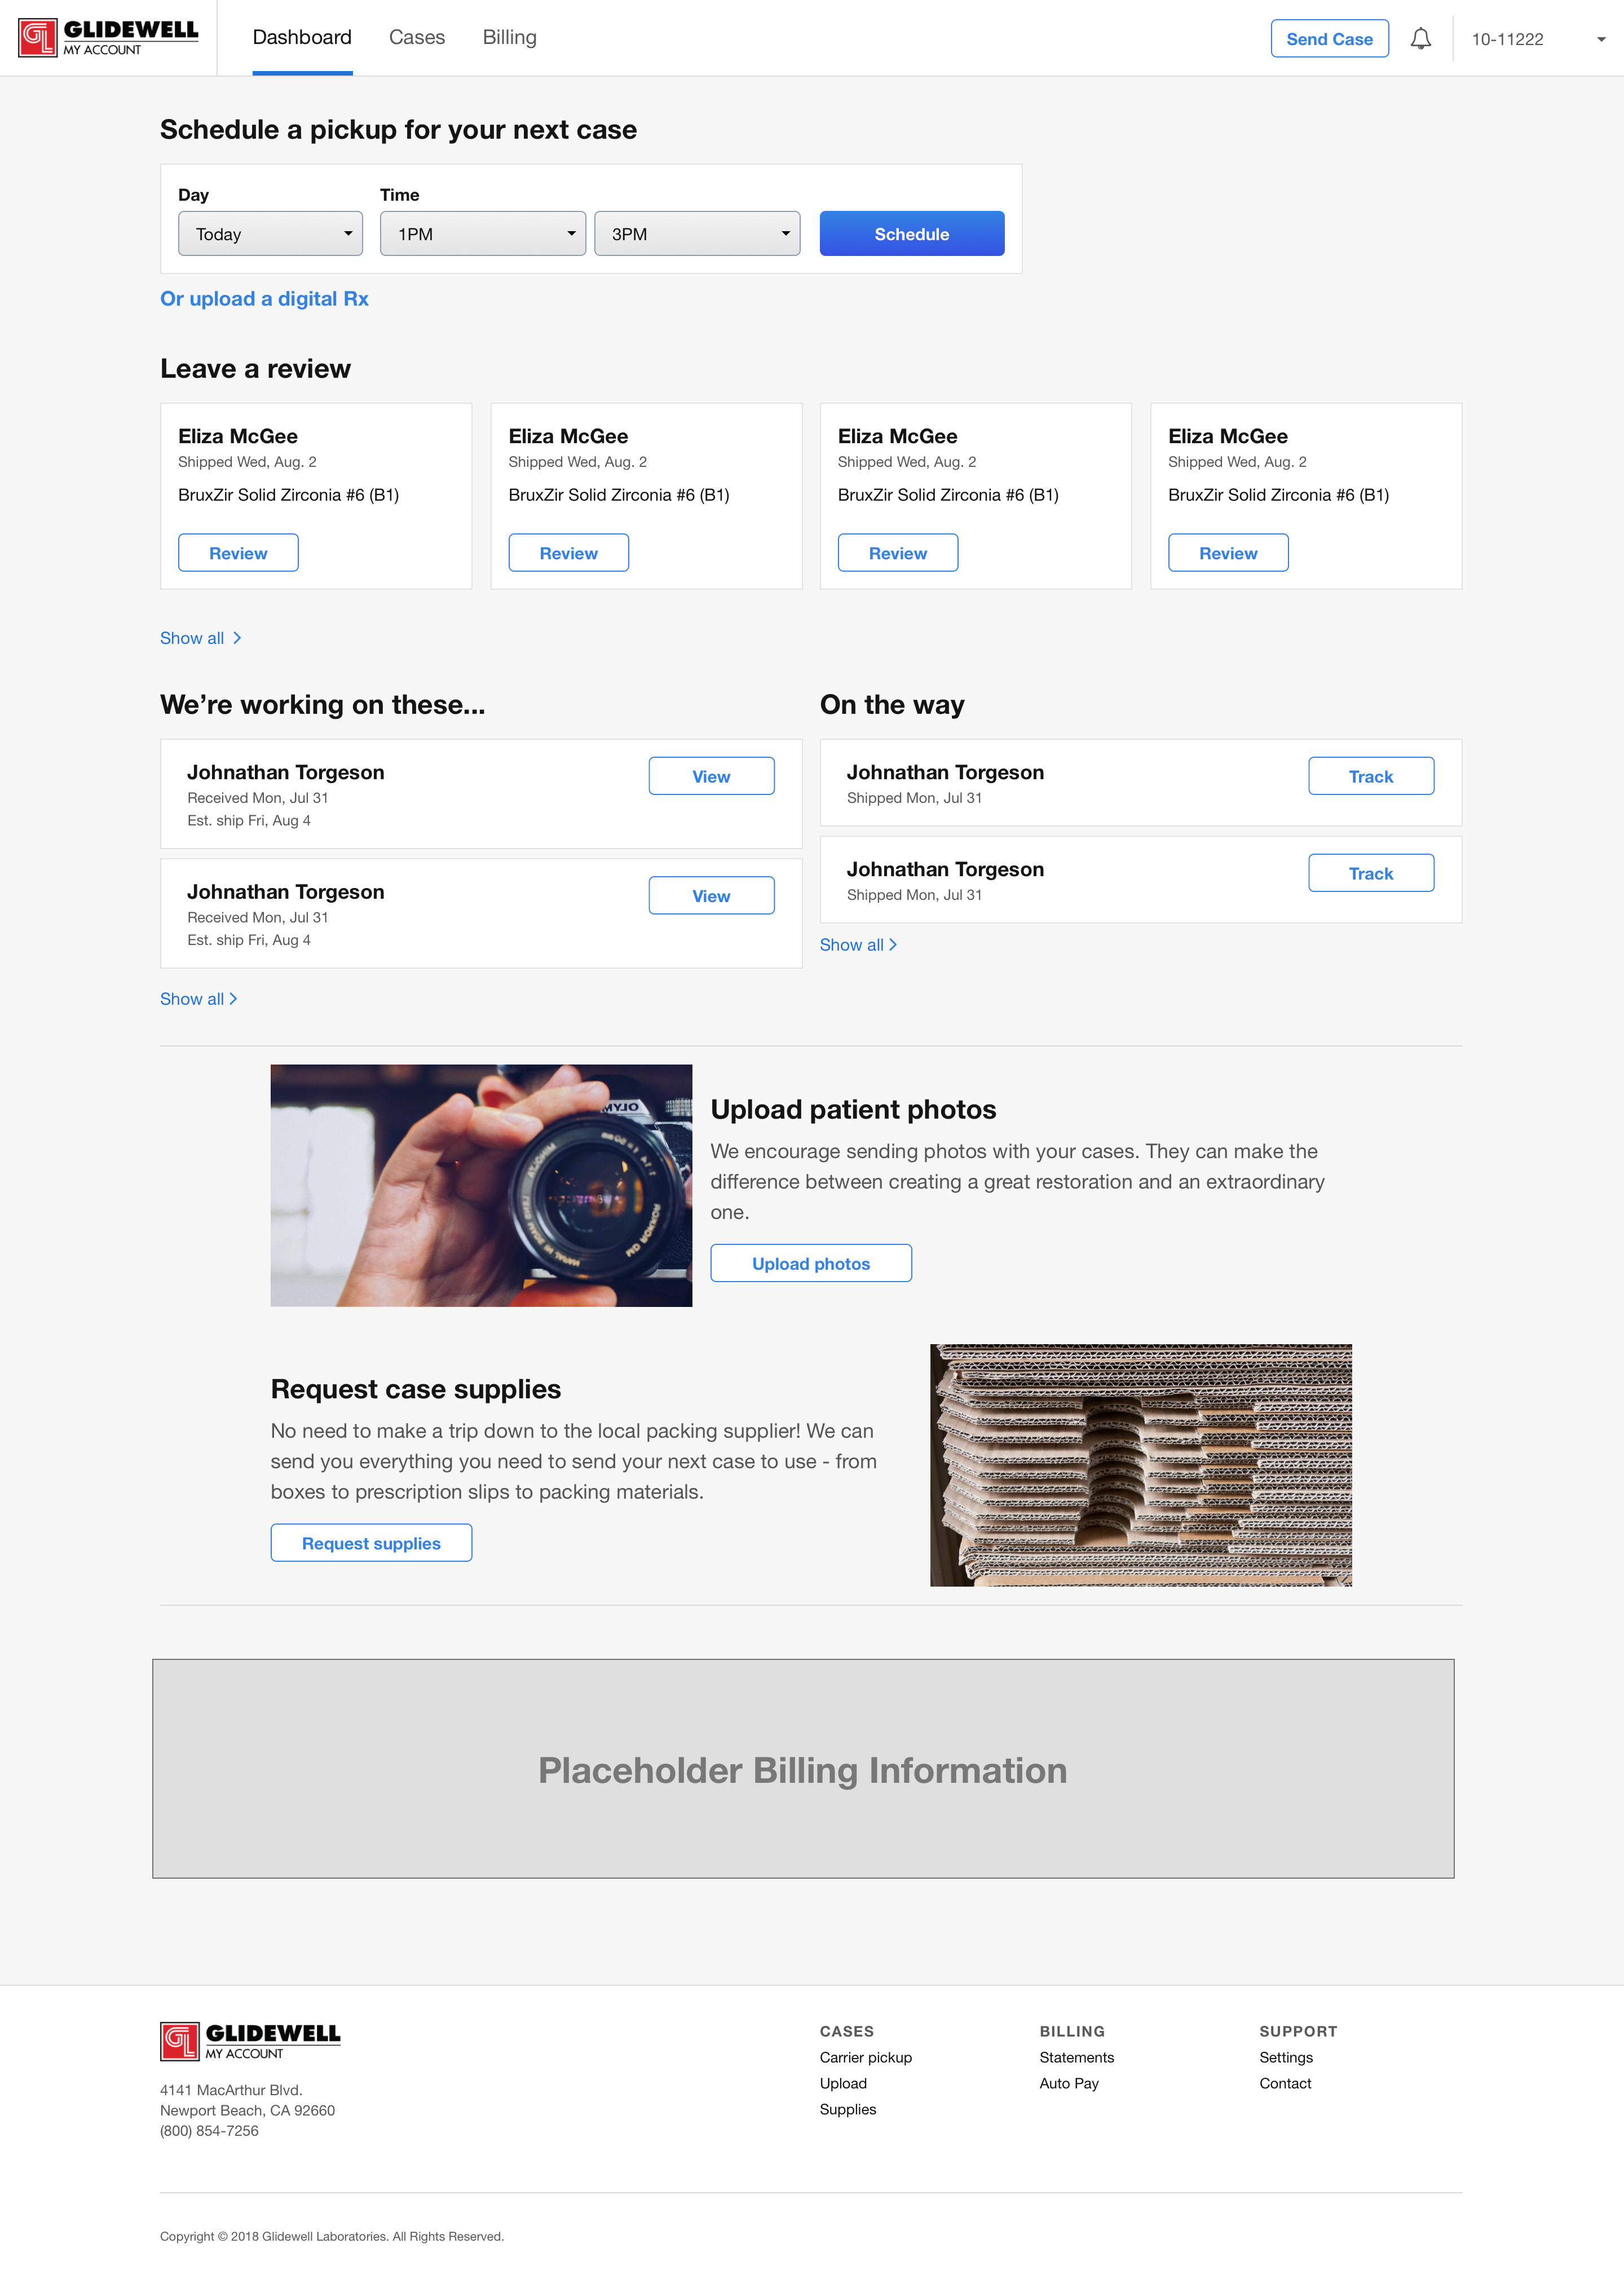
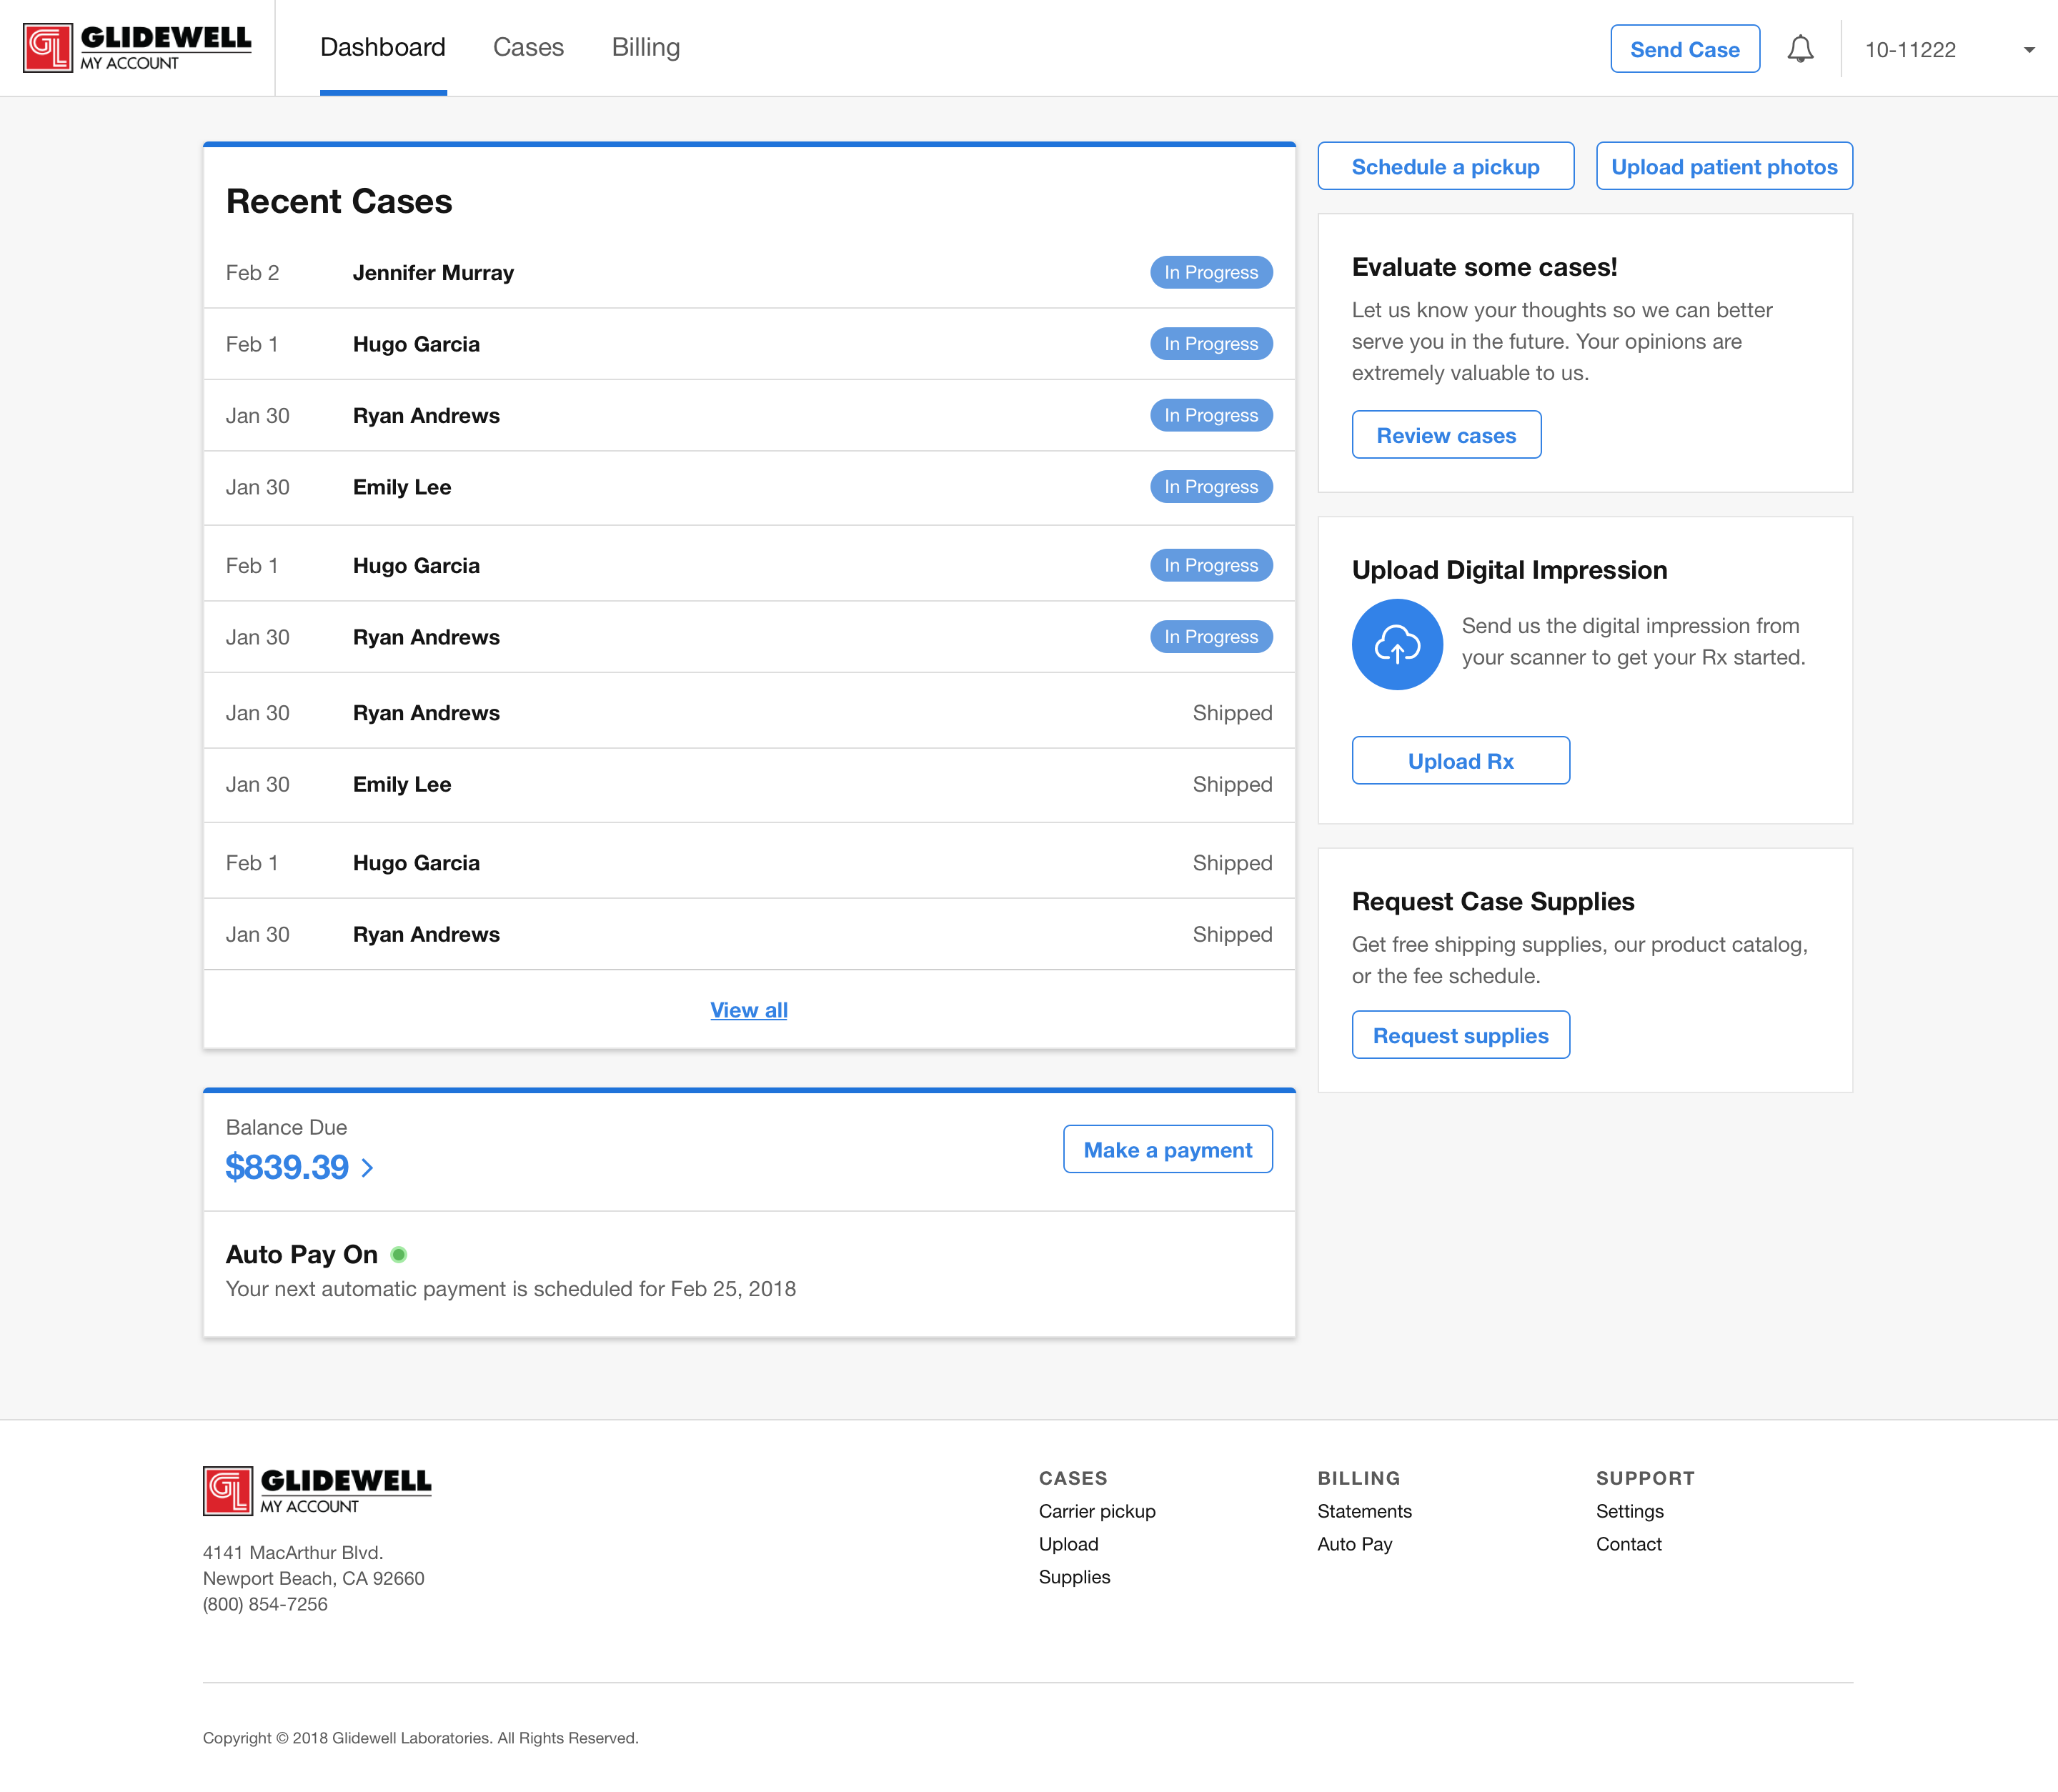
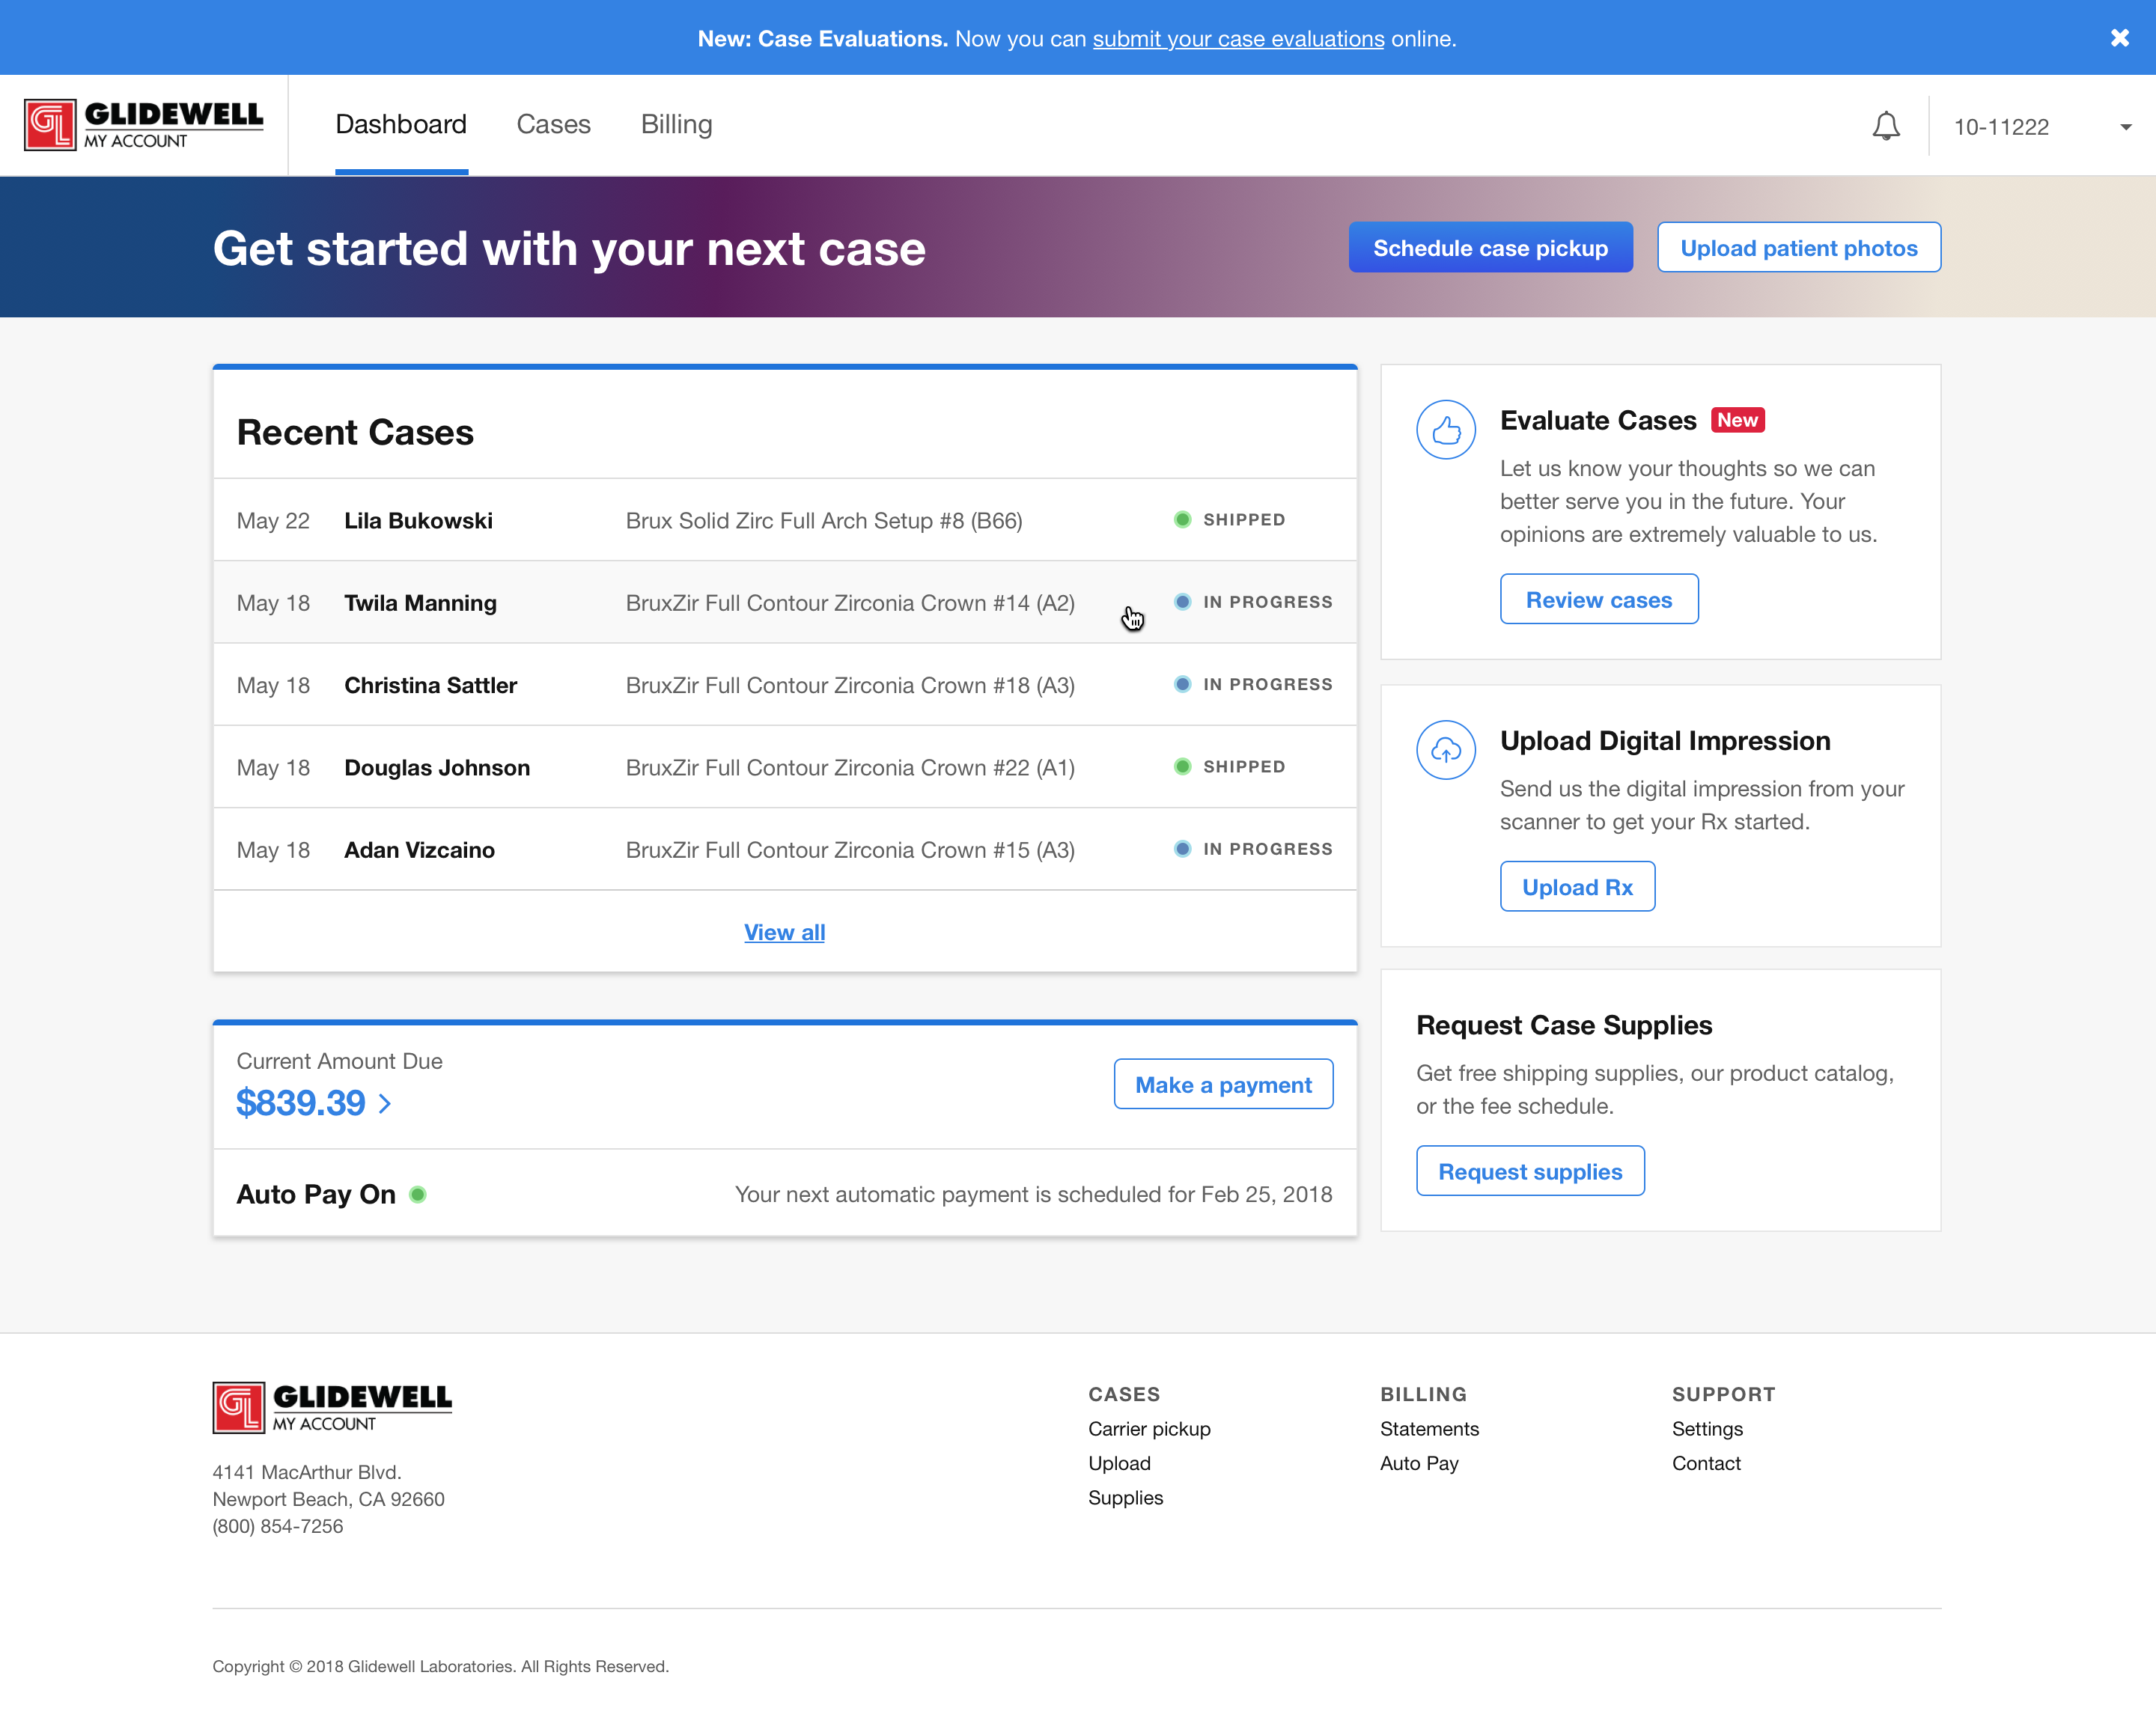
The stakeholders initially asked for a banner to be added to the top of the page as a quick and simple way to draw attention to the feature. Working with the scrum development team, we recognized that this was only going to be a quick and temporary fix to a larger problem.

When looking at the dashboard, the very first page users would see upon signing into the portal, we saw other issues in play. We reviewed recordings of users navigating the page and also took a look at a heatmap to identify some prominent issues:

Dashboard before redesign
The dashboard before the redesign
Heatmap of the dashboard
Heatmap showing where users were interacting on the dashboard
  • Discoverability: It is not immediately obvious how to submit a case evaluation on the dashboard. There were no indicators on the page to let users know that this was even a feature that was available. To get to the case evaluations, users would have to view a case that had already been delivered, and there was very little value in looking at delivered cases for the user.
  • Information hierarchy: Information around billing was too prominent. This was placed in the top left area after a quantitative survey came back saying that customers requested billing features the most. However, with more data (and experience) we realized that something a user wants to use does not necessarily mean they want to use it often. In this case, most of our customers only pay or view their bills once a month when it is due. It also didn't feel very customer-friendly to have the amount owed be the first thing someone sees when they sign in.
  • Providing relevant information: The case list screen was one of the most viewed screens, but the case information provided on the dashboard was rather meaningless. Customers just wanted to know where their cases were and when they would arrive - any other information was secondary.

Watching users navigate the website, we also noticed that most of them would sign in and navigate to their destination page without looking at the dashboard. That just further solidified that we were missing a big opportunity.

Design Quickly

With the information in hand and a clearly defined problem, I set about designing concepts for a better dashboard and came up with some exploratory iterations. A couple of key decisions I made were to make it easy to highlight new features and to define announcement banners that could be used to highlight important information.

Dashboard before redesign

After a couple of rounds of internal design critiques with the design team and scrum development team, I moved forward with the concept that resonated the best with the team. We conducted internal usability tests and made further adjustments, arriving at a final design that went into development.

Dashboard before redesign
The call to action area below the navigation was considered to be too visually similar to a banner and would likely lead to banner blindness.
Dashboard before redesign
Final design that went into production.

Outcomes

After a few months of the new dashboard being in production, we took a look at the case evaluation numbers.

The site was now receiving around 56 case evaluations a week. Not quite reaching our goal of 93, but a 335% increase from the 16 evaluations/week the old dashboard was receiving.

Chart showing increase in case evaluations
The redesigned dashboard was released in August of 2018

We also took the opportunity to ask our users their opinion of the redesigned dashboard. Out of a total of 341 respondents, 90% said they loved it and 10% said they hated it.

Positive

  • I like it. It looks clean and organized.
  • Easier way to see and manage cases.
  • Clear and informative.
  • I can find everything I need.
  • Love it!!!!
  • Awesome Sauce Look!
  • Dashboard immediately displays the information I need - no need to search👍

Negative

  • Easier to see the old way.
  • Too much going on here.
  • There is to much going on. It would be simple. It looks to animated and can be a little overwhelming.
  • It sucks.
  • Stinks.
  • frig u

Leveraging a simple request to add a banner to the portal into a dashboard redesign allowed me to demonstrate the value of providing the problem to the team and allowing them to work out the best solution. This was a big change in a fifty-year-old company that was not used to working in this fashion.

Coming up with success metrics was also a major step away from working as a feature factory.

Looking into the Future

Some next steps that could help move our dentists away from the paper evaluations:

  • Sending nudge emails a few days after a case is delivered.
  • Showing a notification/reminder on the dashboard a few days after a case is delivered.
  • Better explaining the benefits of the evaluation, and that dentists who submit them enjoy higher satisfaction with Glidewell.
  • Quicker ways to submit the evaluation - it’s currently a multiple-choice questionnaire, but asking for a single rating at first and then leading into a follow-up could help.